. 2019 Jun 27;10(1):2832.
doi: 10.1038/s41467-019-10861-2.

A single-nucleus RNA-sequencing pipeline to decipher the molecular anatomy and pathophysiology of human kidneys

Affiliations

A single-nucleus RNA-sequencing pipeline to decipher the molecular anatomy and pathophysiology of human kidneys

Blue B Lake et al. Nat Commun. .

Abstract

Defining cellular and molecular identities within the kidney is necessary to understand its organization and function in health and disease. Here we demonstrate a reproducible method with minimal artifacts for single-nucleus Droplet-based RNA sequencing (snDrop-Seq) that we use to resolve thirty distinct cell populations in human adult kidney. We define molecular transition states along more than ten nephron segments spanning two major kidney regions. We further delineate cell type-specific expression of genes associated with chronic kidney disease, diabetes and hypertension, providing insight into possible targeted therapies. This includes expression of a hypertension-associated mechano-sensory ion channel in mesangial cells, and identification of proximal tubule cell populations defined by pathogenic expression signatures. Our fully optimized, quality-controlled transcriptomic profiling pipeline constitutes a tool for the generation of healthy and diseased molecular atlases applicable to clinical samples.


Conflict of interest statement

The authors declare no competing interests.

Figures

Fig. 1
Fig. 1
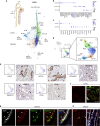
Single-nucleus RNA-seq interrogation of the human kidney. a Overview of kidney tissue processing methods tested for nuclei isolation and snDrop-seq. b UMAP visualization of 17,659 single nuclei (15 individuals, Supplementary Data 4) passing QC filtering (Supplementary Fig. 2a). Source data are provided as a Source Data file. c Schematic of a juxtamedullary nephron showing relevant cell types and associated vasculature. d Table of single-nucleus clusters shown in (b), indicating associated cell-type annotations, number of nuclei per cluster and relative origination from samples encompassing the cortex, medulla or both (Supplementary Data 6 and provided as a Source Data File). UMAP uniform manifold approximation and projection
Fig. 2
Fig. 2
snDrop-seq clusters show distinct expression profiles. a Dot plot of select average gene expression values (log scale) and percentage of nuclei expressing these genes within each cluster (Fig. 1b) for known (bold) and newly discovered cell-type marker genes (see Methods, Supplementary Data 7). b Heatmap showing cluster-specific gene specificity scores (see Methods) for differentially expressed genes associated with CKD eQTL and hypertension risk loci (systolic and diastolic blood pressure variants are indicated). The genes corresponding to these clusters are in Supplementary Data 8. Asterisks indicate higher cluster enrichment (proportion of differentially expressed genes associated with each cluster) of CKD-associated eQTLs in POD and hypertension risk factors in MC. Source data are provided as a Source Data file. CKD chronic kidney disease, eQTL expression quantitative trait loci, POD podocytes
Fig. 3
Fig. 3
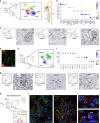
Proximal tubule cell populations. a SWNE analysis of tubule clusters (3–14, 29) for cell types indicated (PT, DTL, ATL, TAL to DCT). Arrow indicates progression of lineages corresponding with expected spatial ordering in vivo. SWNE factor-associated genes (Supplementary Data 9) and relative medulla/cortex originations are indicated. b. Trajectory analysis of main PT clusters supporting their S1, S2 and S3 PT segment identities. c Heatmap of expression (row Z-scores) for genes differentially expressed along the proximal tubule trajectory (Supplementary Data 10) shown in (b). d Dot plot showing select segment-specific marker gene expression (averaged log scale values and percentage of expressed nuclei), localizing the PT clusters Unk and PT-4 to S2 and S3 segments. e Protein immunostaining (Human Protein Atlas, Supplementary Data 16) for select PT markers, including general PT (LRP2), segment-specific (highlighted in c), and Unk/PT-4 cluster (CFH and FGA) markers. Arrows indicate representative protein localization. Scale bar indicates 25 µm. f UMAP plots as in Fig. 1b showing expression level (scaled from low—gray to high—blue) of S2 segment marker ACSM3 and Unk cluster 29 marker CFH. Lower panels show protein fluorescent immunostaining (Supplementary Data 17) for CFH in a subset of PT co-stained with AQP1 expression in PT, but not the PC marker AQP2 (arrows). Location of glomeruli (G) and scale bars (left panel—100 µm; right panel—50 µm) are indicated. Source data for (ad, f) (UMAP plots) are provided as a Source Data file. UMAP uniform manifold approximation and projection, SWNE Similarity Weighted Nonnegative Embedding
Fig. 4
Fig. 4
Cellular and molecular diversity of the collecting ducts. a SWNE analysis of cell clusters (14–21) from distal nephric tubule progressing through collecting duct (DCT, CNT, PC, IC) showing spatial distributions comparable to that expected in vivo. SWNE factor-associated genes (Supplementary Data 9) and relative medulla/cortex originations are indicated. b Dot plot showing select (see Methods) IC marker gene expression (averaged log scale values and percentage of expressed nuclei). c Dot plot showing select (see Methods) cortex and medullary collecting system PC marker gene expression (averaged log scale values and percentage of expressed nuclei). d UMAP as in Fig. 1b showing clusters used in (a). e Protein immunostaining (Human Protein Atlas, Supplementary Data 16) for the select PC and IC markers highlighted in (b) and (c) showing protein localization within the CNT/CD (arrows). UMAP plots show corresponding RNA expression levels (scaled from low—gray to high—blue). Scale bar indicates 25 µm. f Protein fluorescent immunostaining (Supplementary Data 17) for KIT, IC marker TMEM213 and PC marker AQP2 in the cortical collecting ducts. Scale bar indicates 50 µm. g Protein fluorescent immunostaining for KIT, IC marker TMEM213 and PC marker AQP2 in the medullary collecting ducts. Arrows indicate representative AQP2-negative cells showing colocalization of KIT and TMEM213. Scale bar indicates 25 µm. h Protein fluorescent immunostaining showing CGRP enrichment in AQP2− medullary collecting duct cells (arrows). Scale bar indicates 20 µm. Source data for (ad) are provided as a Source Data file. UMAP uniform manifold approximation and projection, SWNE Similarity Weighted Nonnegative Embedding
Fig. 5
Fig. 5
Resolution of endothelial and interstitial lineages. a UMAP as in Fig. 1b showing EC clusters (22–25) and a schematic of the nephron vasculature. b Dot plot showing select (see Methods) EC marker gene expression (log scale values and percentage of expressed nuclei). c Protein immunostaining (Human Protein Atlas, Supplementary Data 16) for the select EC markers highlighted in (b). Arrows indicate representative protein staining. UMAP plots show corresponding RNA expression levels (scaled from low—gray to high—blue). Scale bar indicates 25 µm. d Protein fluorescent immunostaining (Supplementary Data 17) for GC-specific NRG3 and AQP1 expressed in AEA (highlighted in b) and PT. Scale bar indicates 25 µm. e UMAP as in Fig. 1b showing interstitial clusters (26–28). f Dot plot showing select interstitial marker gene expression (see Methods) and within-cluster detection rates. g Protein immunostaining (Human Protein Atlas, Supplementary Data 16) for the select markers highlighted in (f). Arrows indicate representative protein staining. UMAP plots show corresponding RNA expression levels (scaled from low—gray to high—blue). Scale bar indicates 25 µm. h UMAP plots as in Fig. 1b indicating high expressing cells for PIEZO2 (green) and PODXL or PECAM1 (CD31) (red), or both PIEZO2 and PODXL or PECAM1 together (yellow). i Protein fluorescent immunostaining (Supplementary Data 17) for MC-specific PIEZO2, vascular marker PECAM1 and POD markers PODXL and NPHS1. Arrows indicate representative PIEZO2 protein localized to the MC membrane adjacent to POD cells (PODXL) and localized between POD processes (NPHS1). Location of glomeruli (G) and scale bars (left and middle panels—25 µm, right panel (top and bottom)—10 µm) are indicated. Source data for (a, b, e, f, h) are provided as a Source Data file. UMAP uniform manifold approximation and projection
Fig. 6
Fig. 6
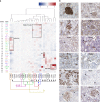
Integrin expression dynamics in the kidney. a Heatmap of averaged scaled gene expression values for integrins detected in the adult human kidney clusters. Enrichment for specific integrins and their indicated binding partners (arrows) were found for specific cell types or nephron segments. Source data are provided as a Source Data file. b Protein immunostainings (Human Protein Atlas, Supplementary Data 16) for select integrins that showed cluster-enriched RNA expression shown in (a). Arrows indicate associated cell types/structures showing enrichment predicted from snDrop-seq data (a). Scale bar indicates 25 µm

Similar articles

Cited by

References

    1. Bertram JF, Douglas-Denton RN, Diouf B, Hughson MD, Hoy WE. Human nephron number: implications for health and disease. Pedia. Nephrol. 2011;26:1529–1533. doi: 10.1007/s00467-011-1843-8. - DOI - PubMed
    1. Lindstrom NO, et al. Conserved and divergent features of human and mouse kidney organogenesis. J. Am. Soc. Nephrol. 2018;29:785–805. - PMC - PubMed
    1. Braun L, Sood V, Hogue S, Lieberman B, Copley-Merriman C. High burden and unmet patient needs in chronic kidney disease. Int. J. Nephrol. Renov. Dis. 2012;5:151–163. - PMC - PubMed
    1. Honeycutt AA, et al. Medical costs of CKD in the Medicare population. J. Am. Soc. Nephrol. 2013;24:1478–1483. doi: 10.1681/ASN.2012040392. - DOI - PMC - PubMed
    1. Neild GH. What do we know about chronic renal failure in young adults? II. Adult outcome of pediatric renal disease. Pedia. Nephrol. 2009;24:1921–1928. doi: 10.1007/s00467-008-1107-4. - DOI - PubMed

Publication types