. 2019 Jun 27;10(1):2826.
doi: 10.1038/s41467-019-10726-8.

Intrinsic enzymatic properties modulate the self-propulsion of micromotors

Affiliations

Intrinsic enzymatic properties modulate the self-propulsion of micromotors

Xavier Arqué et al. Nat Commun. .

Abstract

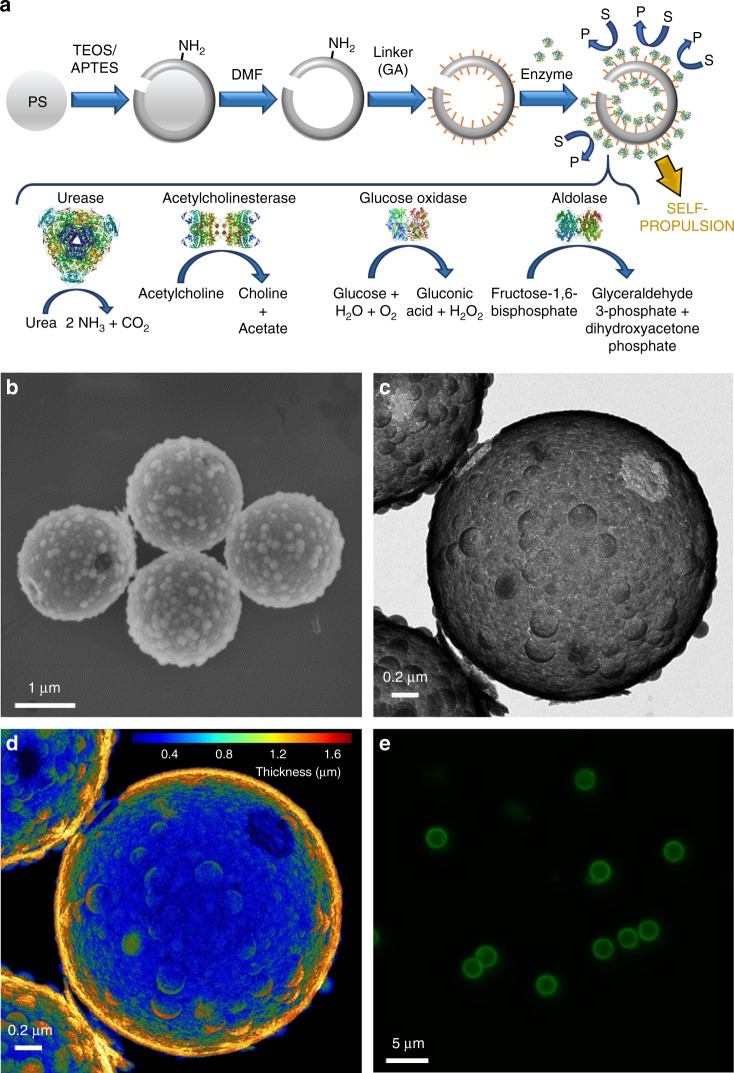
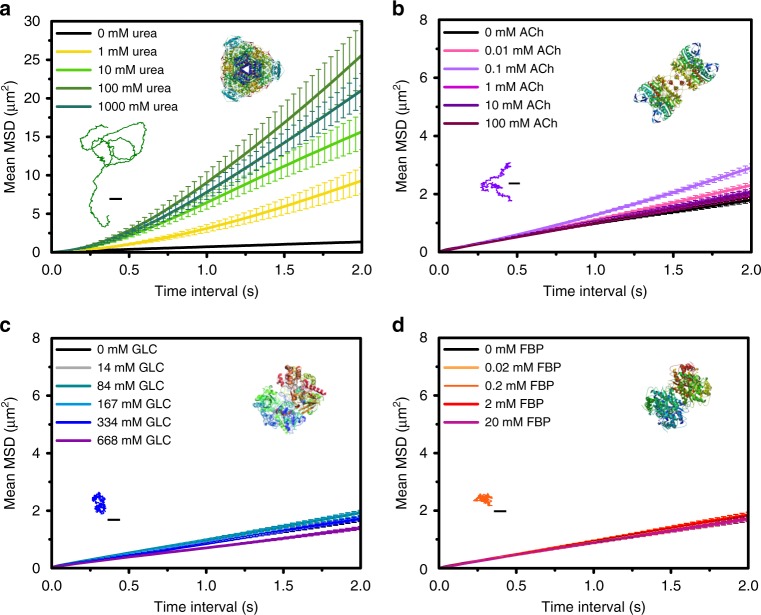
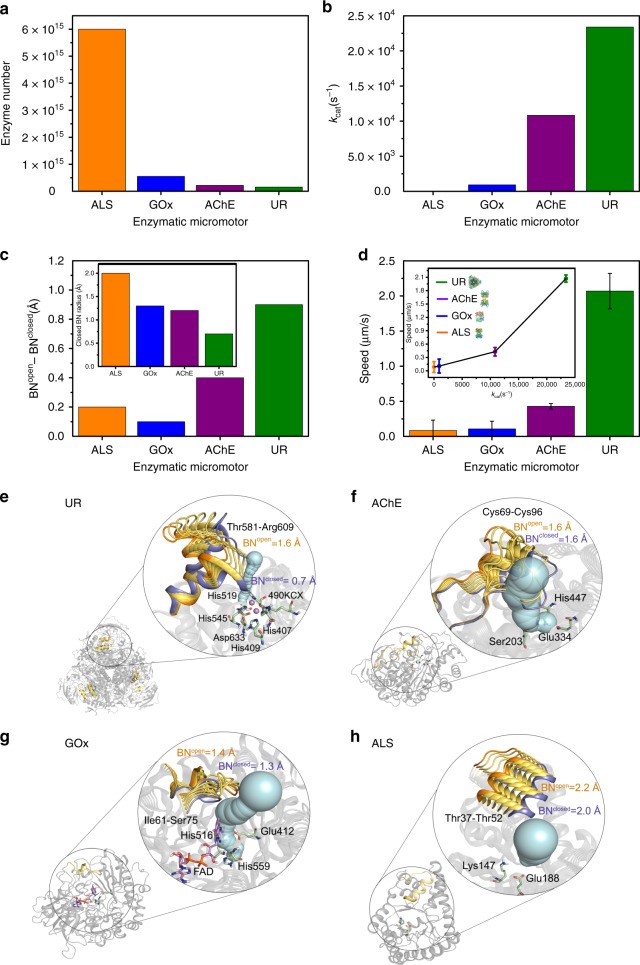
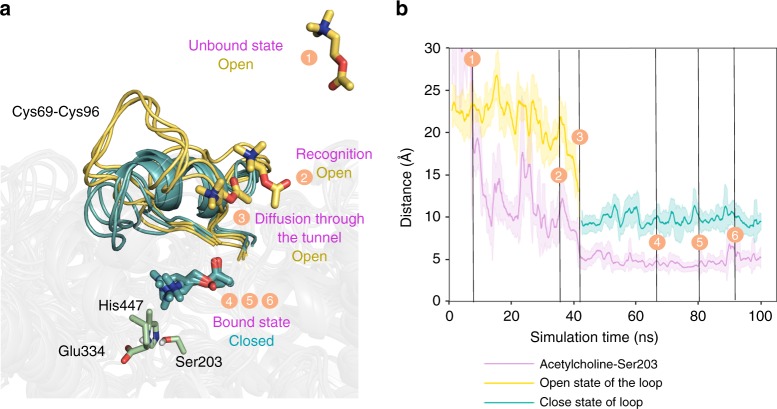
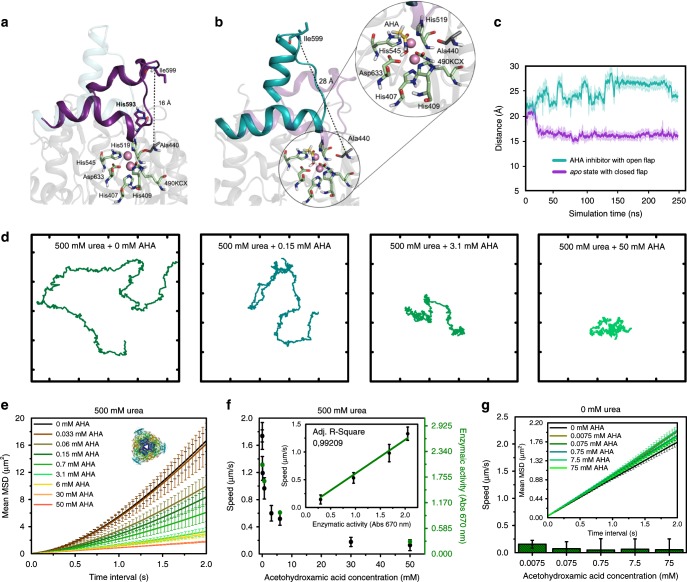
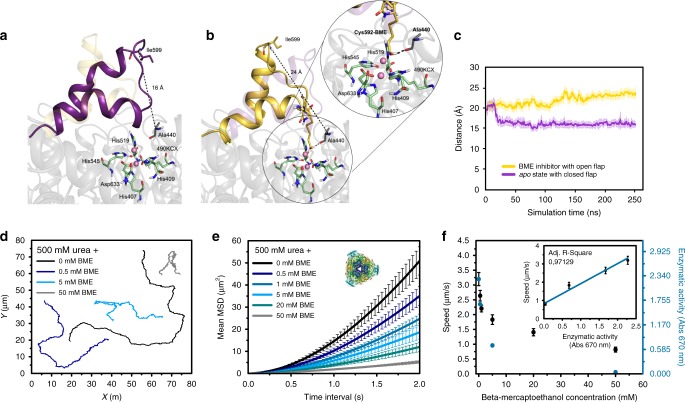
Bio-catalytic micro- and nanomotors self-propel by the enzymatic conversion of substrates into products. Despite the advances in the field, the fundamental aspects underlying enzyme-powered self-propulsion have rarely been studied. In this work, we select four enzymes (urease, acetylcholinesterase, glucose oxidase, and aldolase) to be attached on silica microcapsules and study how their turnover number and conformational dynamics affect the self-propulsion, combining both an experimental and molecular dynamics simulations approach. Urease and acetylcholinesterase, the enzymes with higher catalytic rates, are the only enzymes capable of producing active motion. Molecular dynamics simulations reveal that urease and acetylcholinesterase display the highest degree of flexibility near the active site, which could play a role on the catalytic process. We experimentally assess this hypothesis for urease micromotors through competitive inhibition (acetohydroxamic acid) and increasing enzyme rigidity (β-mercaptoethanol). We conclude that the conformational changes are a precondition of urease catalysis, which is essential to generate self-propulsion.


Conflict of interest statement

The authors declare no competing interests.

Figures

Fig. 1
Fig. 1
Fabrication and characterization of hollow silica micromotors. a Schematic representation of the fabrication process of HSMC functionalized with enzymes to obtain HSMM that catalyze substrates (S) into products (P) resulting in self-propulsion. PS: polystyrene, TEOS: tetraethylorthosilicate, APTES: 3-aminopropyltriethoxysilane, DMF: dimethylformamide, GA: glutaraldehyde. Enzyme structures are extracted from RCSB PDB (see Supplementary Note 3). b SEM and c TEM image of HSMC showing the hole and silica bulks. d False color TEM image showing HSMC thickness. e Fluorescence (Ex/Em = 520/580 nm) of enzymatic HSMM treated with Krypton™ protein staining dye
Fig. 2
Fig. 2
Motion dynamics UR, AChE, GOx, and ALS micromotors. Average MSD over time for different substrate concentrations: a UR-HSMM, b AChE-HSMM, c GOx-HSMM, and d ALS-HSMM. Inset: representative trajectories for a UR-HSMM with 100 mM urea, b AChE-HSMM with 0.1 mM acetylcholine (ACh), c GOx-HSMM with 334 mM glucose (GLC), and d ALS-HSMM with 0.02 mM fructose 1,6-bisphosphate (FBP) (scale bars: 2.5 μm). Enzyme structures are extracted from RCSB PDB (see Supplementary Note 3). Results are shown as the mean ± standard error of the mean (s.e.m.). Twenty particles were analyzed per condition. Source data are provided as a Source Data file
Fig. 3
Fig. 3
Motion dynamics of HSMM as a function of enzymatic intrinsic properties. From (a) to (d) orange is used for ALS, blue for GOx, purple for AChE, and green for UR. a Number of enzymes attached after micromotor functionalization. b Literature values of the turnover number (kcat). c Conformational change (in Å) of bottleneck (BN) to access the active site of each enzyme from open to closed conformation (BNopen–BNclosed) obtained through MD simulations. Inset: BN radius of each enzyme in closed conformation. d Average speeds of the different enzymatic HSMM for substrate concentrations that yield to maximum self-propulsion. Results are shown as the mean ± s.e.m. Twenty particles were analyzed per condition. Inset: correlation of speed and kcat of each enzyme. Source data are provided as a Source Data file. Enzyme structures are extracted from RCSB PDB (see Supplementary Note 3). eh Representation of the most relevant conformational changes occurring in the MD simulations, identified through principal component analysis (PCA) for all studied enzymes. Different conformations adopted during the MD simulations by the most flexible loops are represented as open conformation in orange, intermediate conformations in dark yellow, closed conformations in blue, active site residues in green, cofactors in pink, and the active site tunnel at the open conformation of the loop in light blue. The BN (in Å) of the computed tunnel in the open/closed conformations (BNopen/BNclosed) is shown in orange/blue
Fig. 4
Fig. 4
Binding mechanism of acetylcholine substrate on AChE. a Overlay of representative conformations along the binding pathway obtained from aMD simulations. Open conformations of the loop (defined by Cys69–Cys96 residues) and substrate conformations located outside the active site are represented in dark yellow (events 1–3), while closed conformations of the loop and substrate bound to the active site are shown in teal (events 4–6). Active site residues are shown in green. b Representation of the loop distance (in Å) between Pro78–Ser203 along the aMD simulation. Dark yellow solid line corresponds to open conformations of the loop, while teal color is used to highlight closed conformations. The open-to-closed transition of the loop is correlated to substrate binding, as shown by the purple solid line representing the distance (in Å) between the nitrogen atom of acetylcholine substrate and the oxygen atom of the side-chain of catalytic Ser203. Results are shown as the mean ± standard deviation (s.d.)
Fig. 5
Fig. 5
Conformation of UR and motion behavior of UR-HSMM exposed to AHA. Representative snapshots from MD simulations of a UR in apo state where the flap covering the active site can adopt a closed conformation (purple) and b AHA, which stabilizes wide-open conformations of the flap (teal). The zoom of the active site residues shows catalytic residues in green, nickel atoms in pink, and the AHA inhibitor in yellow. c MD simulated flap distance between Ala440–Ile599 in the apo state (purple) and AHA-bound state (teal). Results are shown as the mean ± standard deviation (s.d.). d Representative 28-s trajectories of UR-HSMM exposed to 500 mM urea and different concentrations of AHA (axis divided into 5 µm fragments). e Average MSD of UR-HSMM exposed to AHA with urea present in excess (500 mM). Enzyme structures are extracted from RCSB PDB (see Supplementary Note 3). f Average speed of UR-HSMM, extracted from the MSD analysis, and enzymatic activity for different AHA concentrations with urea present in excess (500 mM). Inset: correlation between speed of UR-HSMM and its enzymatic activity depending on inhibition. g Average speeds of UR-HSMM for different concentrations of AHA. Inset: average MSD of UR-HSMM exposed to AHA. Results are shown as the mean ± s.e.m. Twenty particles were analyzed per condition. Source data are provided as a Source Data file
Fig. 6
Fig. 6
Conformation of UR and motion behavior of UR-HSMM exposed to BME. Representative snapshots taken from the MD simulations of a UR in apo state where the flap covering the active site can adopt a closed conformation (purple) and b BME which stabilizes more open conformations of the flap (yellow). The zoom of the active site residues shows catalytic residues in green, nickel atoms in pink, and the Cys592-BME inhibitor in yellow. c MD simulated flap distance between Ala440–Ile599 in the apo state (purple) and Cys592-BME state (yellow). Closed conformations have distances of about 16 Å while open conformations have 25 Å. Results are shown as the mean ± standard deviation (s.d.). d Representative trajectories of UR-HSMM exposed to 500 mM urea and different concentrations of BME. e Average MSD representation of UR-HSMM exposed to BME with urea present in excess (500 mM). Enzyme structures are extracted from RCSB PDB (see Supplementary Note 3). f Average speed of UR-HSMM, extracted from the MSD analysis and enzymatic activity for different BME concentrations with urea present in excess (500 mM). Inset: correlation of speed of UR-HSMM and its enzymatic activity depending on inhibition. Results are shown as the mean ± s.e.m. 22 Particles were analyzed for 0 and 50 mM BME, 19 particles were analyzed for 0.5 and 20 mM BME, and 21 particles were analyzed for 1 and 5 mM BME. Source data are provided as a Source Data file

References

    1. Maria-Solano MA, Serrano-Hervás E, Iglesias-ferna J, Romero-rivera A, Osuna S. Role of conformational dynamics in the evolution of novel enzyme function. Chem. Commun. 2018;54:6622–6634. doi: 10.1039/C8CC02426J. - DOI - PMC - PubMed
    1. Benkovic SJ, Hammes-Schiffer S. A perspective on enzyme catalysis. Science. 2003;301:1196–1202. doi: 10.1126/science.1085515. - DOI - PubMed
    1. Zhao X, Gentile K, Mohajerani F, Sen A. Powering motion with enzymes. Acc. Chem. Res. 2018;51:2373–2381. doi: 10.1021/acs.accounts.8b00286. - DOI - PubMed
    1. Ma X, Hortelão AC, Patiño T, Sánchez S. Enzyme catalysis to power micro/nanomachines. ACS Nano. 2016;10:9111–9122. doi: 10.1021/acsnano.6b04108. - DOI - PMC - PubMed
    1. Riedel C, et al. The heat released during catalytic turnover enhances the diffusion of an enzyme. Nature. 2014;517:227–230. doi: 10.1038/nature14043. - DOI - PMC - PubMed

Publication types