. 2019 Jun 27;9(1):9328.
doi: 10.1038/s41598-019-44974-x.

DNA extraction and amplicon production strategies deeply inf luence the outcome of gut mycobiome studies

Affiliations

DNA extraction and amplicon production strategies deeply inf luence the outcome of gut mycobiome studies

Alessandra Frau et al. Sci Rep. .

Abstract

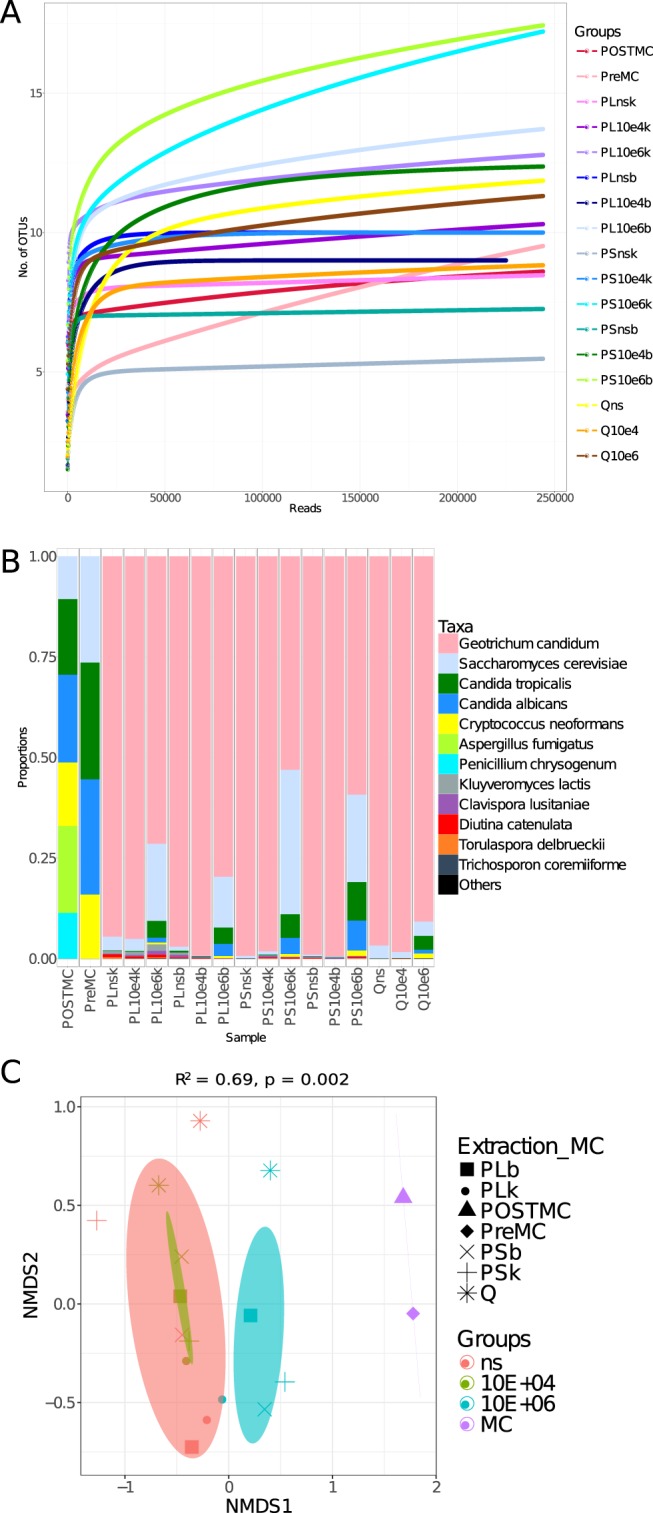
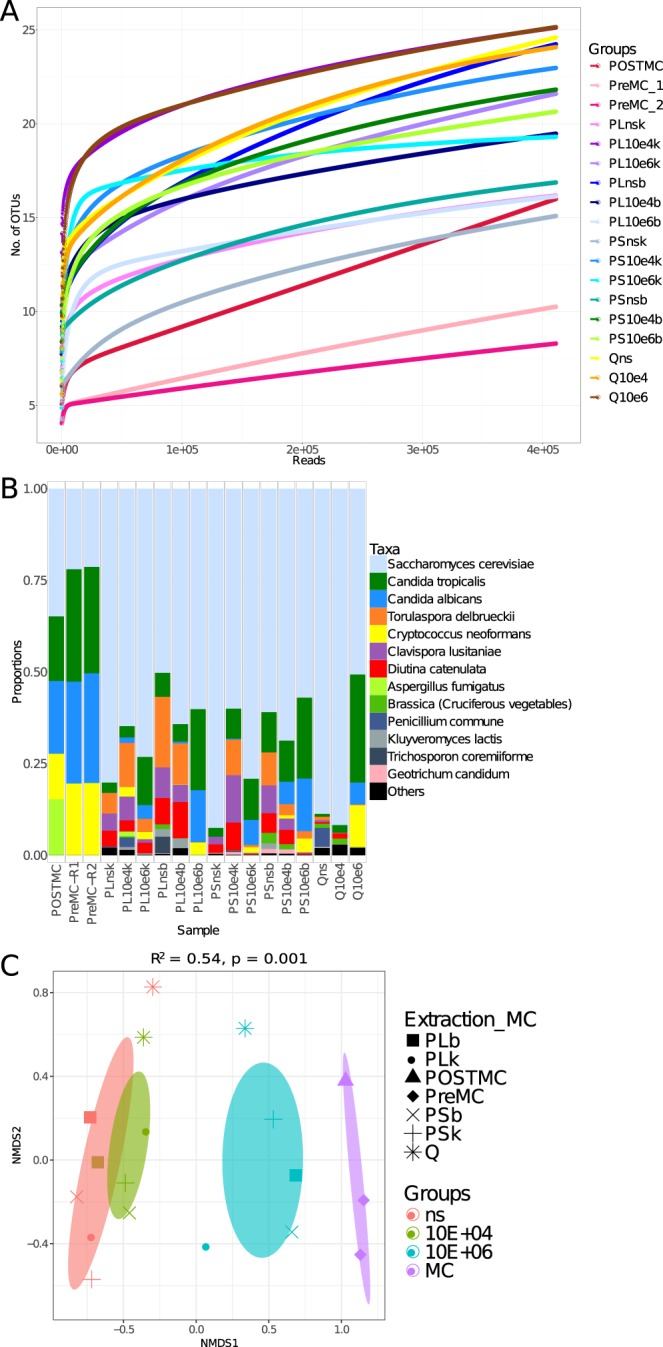
Microbial ecology studies are often performed through extraction of metagenomic DNA followed by amplification and sequencing of a marker. It is known that each step may bias the results. These biases have been explored for the study of bacterial communities, but rarely for fungi. Our aim was therefore to evaluate methods for the study of the gut mycobiome. We first evaluated DNA extraction methods in fungal cultures relevant to the gut. Afterwards, to assess how these methods would behave with an actual sample, stool from a donor was spiked with cells from the same cultures. We found that different extraction kits favour some species and bias against others. In terms of amplicon sequencing, we evaluated five primer sets, two for ITS2 and one for ITS1, 18S and 28S rRNA. Results showed that 18S rRNA outperformed the other markers: it was able to amplify all the species in the mock community and to discriminate among them. ITS primers showed both amplification and sequencing biases, the latter related to the variable length of the product. We identified several biases in the characterisation of the gut mycobiome and showed how crucial it is to be aware of these before drawing conclusions from the results of these studies.


Conflict of interest statement

The authors declare no competing interests.

Figures

Figure 1
Figure 1
18S rRNA qPCR results (A,C,D,E) and flowchart (B) showing the aliquoting, spiking and extraction of the stool sample. This was aliquoted (line 2 of the flowchart), then a third of the aliquots was spiked with 106 cells of each species of the mock community, a third was spiked with 104 cells and the final third was analysed as it was (non-spiked). These were then extracted using 5 different methods (box). (A) Comparison of the PSP kit performance with extra bead beating (PLb) and without (PLk). (C) Comparison of the PSP kit (PLk) performance versus the Qiagen kit (QSK). (A,C) The relative abundance (DNA concentration) was normalised to the mean of all values. A Welch t-test was used to compare the means of the two extraction methods for each species; where results were found to be significant, this is shown in the figure (ns: p > 0.05; *p <= 0.05; **p <= 0.01; ***p <= 0.001; ****p <= 0.0001). The error bars denote standard deviation of the mean (SD). Fungal strains: Ca = C. albicans, Ct = C. tropicalis, Sc = S. cerevisiae, Cn = C. neoformans, Mf = M. furfur, Af = A. fumigatus, Pc = P. crysogenum. (D) Bar chart showing the number of 18S rRNA copies in 100 mg of spiked/non-spiked stools. The samples are grouped according to the extraction method, as shown in the flowchart. The colours indicate the spiking (ns = non-spiked, 104 and 106 cells). (E) Pair-wise comparison of 18S rRNA gene copies (method = wilcox.test) in 10 mg of stool from donors (n = 24) extracted with PSb and QSK kits. A list of sample names with related descriptions can be found in Table 1. *Sample preparation for the QSK extraction was done separately following the first aliquoting.
Figure 2
Figure 2
Use of the 18S rRNA primer set to define fungal diversity in stool (n = 15) and mock community (n = 3). (A) Rarefaction curves showing the number of OTUs versus the number of reads per sample. (B) Taxa summary showing the relative abundance of species, with each bar representing a sample. (C) Ordination of samples according to their community calculated through Non-Metric Distance Scaling (NMDS) was produced using unweighted UniFrac (top) and Bray-Curtis (bottom) distances. The ellipses were drawn at the 95% confidence interval of standard error and the mean value of the groups. PERMANOVA was used to assess if the clustering was significant. The R2 refers to the percentage of variability explained by the groups in terms of microbial community structure. A list of sample names, each with a related description, can be found in Table 1.
Figure 3
Figure 3
Use of the ITS2 (ITS3tagmix/ITS4NGS) primer set to define fungal diversity in stool (n = 15) and mock community (n = 2). (A) Rarefaction curves showing the number of OTUs versus the number of reads per sample. (B) Taxa summary showing the relative abundance of species, with each bar representing a sample. (C) Ordination of samples according to their community, calculated through NMDS, was produced using Bray-Curtis distance. The ellipses were drawn at the 95% confidence interval of standard error and the mean value of the groups. PERMANOVA was used to assess if the clustering was significant. The R2 refers to the percentage of variability explained by the groups in terms of microbial community structure. A list of sample names, each with a related description, can be found in Table 1.
Figure 4
Figure 4
ITS2 (gITS7/ITS4NGS) primer set performance in defining fungal diversity in stool (n = 15) and mock community (n = 3). (A) Rarefaction curves showing the number of OTUs versus the number of reads per sample. (B) Taxa summary showing the relative abundance of species, with each bar representing a sample. (C) Ordination of samples according to their community, calculated through NMDS, was produced using Bray-Curtis distance. The ellipses were drawn at the 95% confidence interval of standard error and the mean value of the groups. PERMANOVA was used to assess if the clustering was significant. The R2 refers to the percentage of variability explained by the groups in terms of microbial community structure. A list of sample names, each with a related description, can be found in Table 1.
Figure 5
Figure 5
Performance of the ITS1 primer set in the mock community (n = 2) (A,C) and 28S rRNA in the mock community (n = 2) (B,D). ITS1 (A) and 28S rRNA (B) rarefaction curves showing the number of OTUs versus the number of reads per sample. ITS1 (C) and 28S rRNA (D) taxa summaries showing the relative abundance of species with each bar representing a sample. A list of sample names, each with a related description, can be found in Table 1.
Figure 6
Figure 6
Sequencing results of 18S rRNA (A,B) from donors (n = 24) and ITS2 (C,D) (n = 19). (A) Rarefaction curves showing the number of OTUs versus the number of reads per sample. (B) Taxa summary at species level, with each column representing a sample. (C) Rarefaction curves showing the number of OTUs versus the number of reads per sample. (D) Taxa summary at species level, with each column representing a sample.

References

    1. Richard ML, Lamas B, Liguori G, Hoffmann TW, Sokol H. Gut fungal microbiota: the Yin and Yang of inflammatory bowel disease. Inflammatory Bowel Diseases. 2014;21:656–665. doi: 10.1097/MIB.0000000000000261. - DOI - PubMed
    1. Liguori G, et al. Fungal dysbiosis in mucosa-associated microbiota of Crohn’s disease patients. Journal of Crohn’s and Colitis. 2015;10:296–305. doi: 10.1093/ecco-jcc/jjv209. - DOI - PMC - PubMed
    1. Hoarau G, et al. Bacteriome and mycobiome interactions underscore microbial dysbiosis in familial Crohn’s disease. Mbio. 2016;7:e01250–16. doi: 10.1128/mBio.01250-16. - DOI - PMC - PubMed
    1. Sokol H, et al. Fungal microbiota dysbiosis in IBD. Gut. 2017;66:1039–1048. doi: 10.1136/gutjnl-2015-310746. - DOI - PMC - PubMed
    1. Tedersoo L, Lindahl B. Fungal identification biases in microbiome projects. Environmental Microbiology Reports. 2016;8:774–779. doi: 10.1111/1758-2229.12438. - DOI - PubMed

Publication types

MeSH terms