Review
. 2019 Nov;13(11):2639-2646.
doi: 10.1038/s41396-019-0463-3. Epub 2019 Jun 27.

How sample heterogeneity can obscure the signal of microbial interactions

Affiliations
Review

How sample heterogeneity can obscure the signal of microbial interactions

David W Armitage et al. ISME J. 2019 Nov.

Abstract

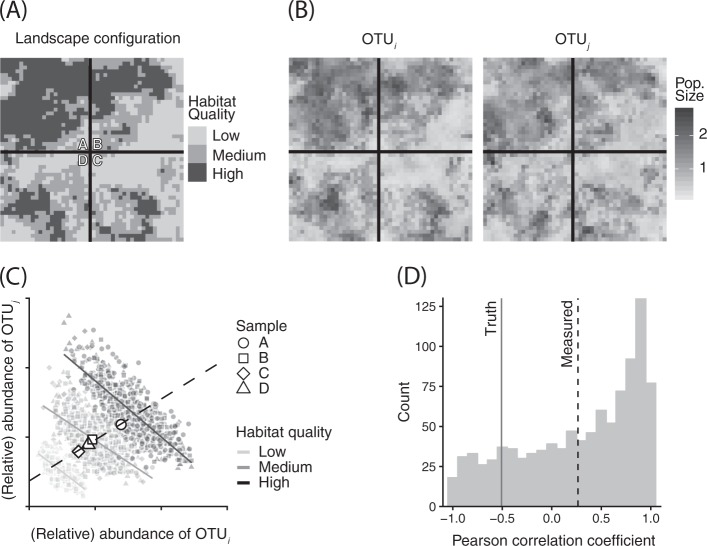
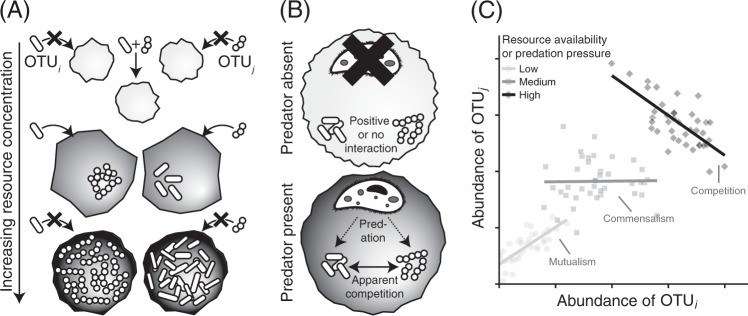
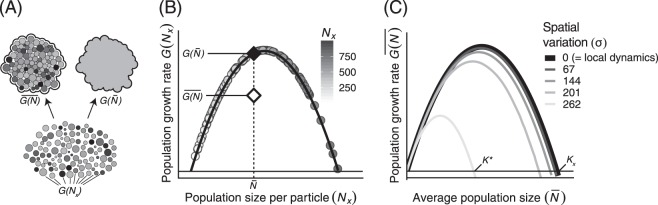
Microbial community data are commonly subjected to computational tools such as correlation networks, null models, and dynamic models, with the goal of identifying the ecological processes structuring microbial communities. A major assumption of these methods is that the signs and magnitudes of species interactions and vital rates can be reliably parsed from observational data on species' (relative) abundances. However, we contend that this assumption is violated when sample units contain any underlying spatial structure. Here, we show how three phenomena-Simpson's paradox, context-dependence, and nonlinear averaging-can lead to erroneous conclusions about population parameters and species interactions when samples contain heterogeneous mixtures of populations or communities. At the root of this issue is the fundamental mismatch between the spatial scales of species interactions (micrometers) and those of typical microbial community samples (millimeters to centimetres). These issues can be overcome by measuring and accounting for spatial heterogeneity at very small scales, which will lead to more reliable inference of the ecological mechanisms structuring natural microbial communities.


Conflict of interest statement

The authors declare that they have no conflict of interest.

Figures

Fig. 1
Fig. 1
Example of how Simpson’s paradox can influence the identification of interspecific interactions. a We randomly generated microbial landscapes with underlying spatial heterogeneity in habitat quality and then simulated competition between two OTUs using a spatially explicit gLV model with local dispersal. b After 60 generations, the populations had reached global equilibria. c From these gridded populations, we can see that the interspecific Pearson’s correlation coefficients, when controlled for habitat type, show the true negative correlations. However, correlations measured using samples taken from these landscapes (here, the solid lines bisecting panel a), result in erroneous estimates of interspecific correlations. d To assess the generality of this finding, we repeated this simulation exercise 1000 times across a variety of different habitat configurations and found that, on average, the sample-scale interspecific correlation coefficients (dashed line) do not have the same sign as the true, local-scale coefficients (solid line). Methods and code are provided in the supplementary information
Fig. 2
Fig. 2
Examples of context-dependent species interactions. a Resource availability can modulate the sign of interspecific interactions. For instance, local resource limitation can weaken the strength of competition when (i) it selects for cross-feeding or another mutualistic, resource-concentrating behavior, or (ii) when it limits the strength of interspecific negative density dependence. b Likewise, in situations where a shared predator is present, species that do not compete for shared resources can experience apparent competition by supplementing the predator densities. The dashed lines denote trophic interactions, solid line denotes competitive interaction. c These context-dependent interactions can lead to highly variable estimates of the signs of OTU interactions, depending on the spatial distribution of resources or predators within the sample
Fig. 3
Fig. 3
a Illustration of the concept of scaling-up local microbial community dynamics to quantify the behavior of an aggregate sample. Degree of shading denotes an OTU’s population sizes across a heterogeneous collection of particles governed by the shared, nonlinear dynamics, G(Nx), from Eq. 2. Note the conceptual differences between aggregating these data by averaging over the local nonlinear dynamics, GN¯, and by fitting our small-scale dynamical model to the average population density, GN¯. b The differences in these aggregation procedures result in differing estimates for scaled-up population dynamics. The black curve shows the logistic governing dynamics, G(Nx), of populations on individual particles (shaded circles). Note the difference in growth rates between the correctly spatially averaged growth function (white diamond) and growth function fit to the spatial average population density (black diamond). c Increasing the spatial variation of local populations results in vastly different spatially averaged population dynamics. Here again, the black line denotes the local dynamics, G(Nx), which equals the spatially averaged dynamics when there is no variation among subpopulations. For this concave-down function, increasing the spatial variation causes the scaled-up carrying capacity, K*, to be smaller than the local carrying capacity, Kx

References

    1. Thompson LR, Sanders JG, McDonald D, Amir A, Ladau J, Locey KJ, et al. A communal catalogue reveals Earth’s multiscale microbial diversity. Nature. 2017;551:457–63. doi: 10.1038/nature24621. - DOI - PMC - PubMed
    1. Prosser JI, Bohannan BJM, Curtis TP, Ellis RJ, Firestone MK, Freckleton RP, et al. The role of ecological theory in microbial ecology. Nat Rev Microbiol. 2007;5:384–92. doi: 10.1038/nrmicro1643. - DOI - PubMed
    1. Nemergut DR, Schmidt SK, Fukami T, O’Neill SP, Bilinski TM, Stanish LF, et al. Patterns and processes of microbial community assembly. Microbiol Mol Biol Rev. 2013;77:342–56. doi: 10.1128/MMBR.00051-12. - DOI - PMC - PubMed
    1. Faust K, Raes J. Microbial interactions: from networks to models. Nat Rev Micro. 2012;10:538–50. doi: 10.1038/nrmicro2832. - DOI - PubMed
    1. Bálint M, Bahram M, Eren AM, Faust K, Fuhrman JA, Lindahl B, et al. Millions of reads, thousands of taxa: microbial community structure and associations analyzed via marker genes. FEMS Microbiol Rev. 2016;40:686–700. doi: 10.1093/femsre/fuw017. - DOI - PubMed

Publication types