Review
. 2019 Jul;16(7):587-594.
doi: 10.1038/s41592-019-0457-0. Epub 2019 Jun 27.

Best practices and benchmarks for intact protein analysis for top-down mass spectrometry

Affiliations
Review

Best practices and benchmarks for intact protein analysis for top-down mass spectrometry

Daniel P Donnelly et al. Nat Methods. 2019 Jul.

Abstract

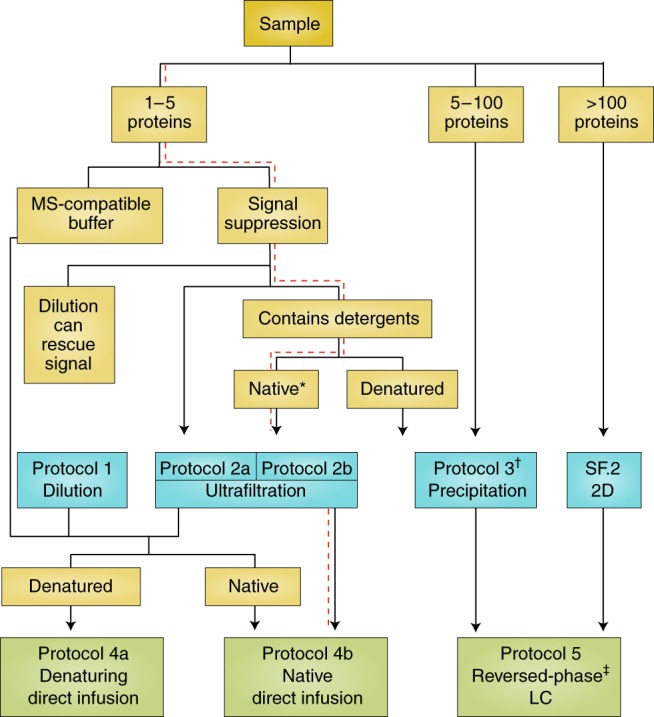
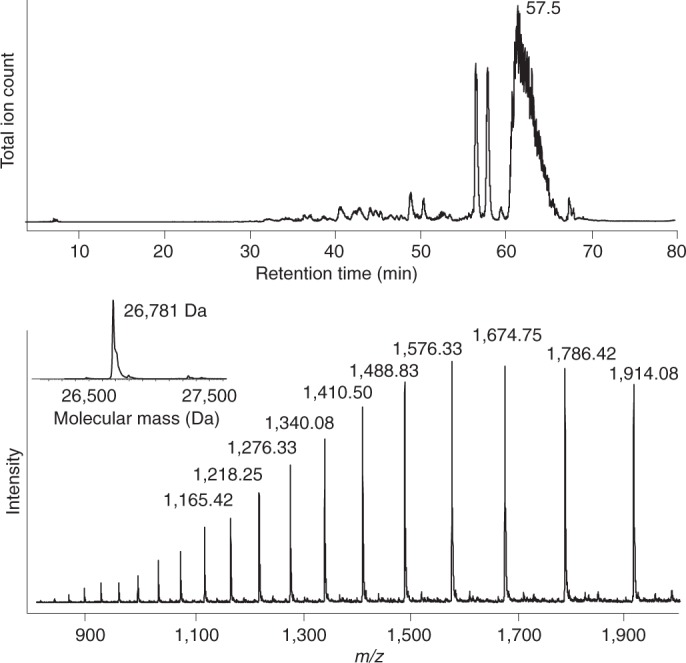
One gene can give rise to many functionally distinct proteoforms, each of which has a characteristic molecular mass. Top-down mass spectrometry enables the analysis of intact proteins and proteoforms. Here members of the Consortium for Top-Down Proteomics provide a decision tree that guides researchers to robust protocols for mass analysis of intact proteins (antibodies, membrane proteins and others) from mixtures of varying complexity. We also present cross-platform analytical benchmarks using a protein standard sample, to allow users to gauge their proficiency.


Conflict of interest statement

Authors with company affiliations include J.L.L. (Amgen), K.C.A. (Alnylam), R.S. (Biogen), J.J.W. (Bruker), I.D.G.C. (Amgen), P.O.D. (Eastwoods Consulting) and Y.O.T. (Spectroswiss).

Figures

Fig. 1
Fig. 1. Common buffer components suppress MS signal.
a, MgCl2 reduces signal (and S/N) in a concentration-dependent manner. b, Fit of experimental data to determine the concentration of MgCl2 required for 50% signal suppression (SC50; black arrow), c, Table of common buffer components and the concentration threshold for 50% SC50 (experimental data curves and their fits are shown in Supplementary Fig. 1) and calculations in Supplementary Note 2. Detergents compatible with mass spectrometry are discussed in Protocol 2b. *Signal suppression by detergents is less pronounced above their critical micellar concentration (CMC) (described in Protocol 2b).
Fig. 2
Fig. 2. Decision tree for intact protein sample clean-up, preparation and analysis.
The red dashed line, for example, denotes the decision path for the native MS analysis of a membrane protein. *LC can also be applied at this stage in the decision tree. Minimally complex protein samples prepared following Protocol 3 can be analyzed via denaturing direct infusion (Protocol 4a) if desired. Supplementary Fig. 2 (SF.2) shows a recommended example of 2D separation following the GELFrEE protocol. Other viable alternative separation techniques include capillary zone electrophoresis, ion exchange and size exclusion chromatography.
Fig. 3
Fig. 3. Dilution (Protocol 1), MWCO ultrafiltration (Protocol 2a) and precipitation (Protocol 3) sample preparation protocols applied to common buffers.
a,b, Protein standard mixture in PBS (a) and detergent-containing RIPA buffer (b). In the buffer containing harsh detergents, protein signal is attained only with precipitation. c, NISTmAb in 12.5 mM L-histidine, 12.5 mM L-histidine HCl (pH 6.0). Mass spectra were obtained using a Fourier transform ion cyclotron resonance MS (FT-ICR) (Bruker Daltronics SolariX 9.4T MS) using denaturing direct infusion (Protocol 4a). See Supplementary Fig. 3 for additional results with ‘gentle elution’ immunoaffinity elution buffer and a second antibody buffer.
Fig. 4
Fig. 4. Denatured versus native ESI-MS of carbonic anhydrase.
Intensity is scaled to demonstrate the difference between denaturing MS (left) and native MS (right). These spectra were collected on the same instrument using the same concentration (10 µM). Native MS results in lower and fewer charge states, and thus the signals have higher intensity and appear at a higher m/z. The inset includes the most abundant charge state and the S/N.
Fig. 5
Fig. 5. LC-MS of protein standard mixture prepared following Protocol 5a and separated on a Dionex UPLC with a Thermo Orbitrap Elite system using PLRP-S stationary phase.
Final concentrations of each protein loaded onto the column were 0.14 pmol ubiquitin, 0.49 pmol trypsinogen, 1.09 pmol myoglobin and 0.64 pmol carbonic anhydrase (top). Summary of S/N values calculated for each protein on all instrumentation platforms using the given SOP (bottom) including Dionex Ultimate 3000–Thermo Orbitrap Elite, Waters Acquity–Xevo G2-S QTOF, Waters nanoAcquity–Bruker Impact II QTOF, Waters nanoAcquity–Bruker SolariX FT-ICR, Dionex Ultimate 3000–Thermo Fusion Lumos, and Dionex Ultimate 3000–Thermo QE-HF. As described, S/N calculations differ per manufacturer and do not reflect absolute performance.
Fig. 6
Fig. 6. LC-MS of bacteriorhodopsin-containing purple membrane of H. salinarum prepared following Protocol 5b and analyzed on an Agilent HPLC system coupled to a Thermo linear ion trap (LTQ) mass spectrometer.
Proteins were separated using an Agilent PLRP-S 300 Å, 2.1 × 150 mm, 3 µm. Supplementary Fig. 12 demonstrates this analysis on four additional instrumentation platforms.

References

    1. Smith LM, Kelleher NL. Proteoform: a single term describing protein complexity. Nat. Methods. 2013;10:186–187. doi: 10.1038/nmeth.2369. - DOI - PMC - PubMed
    1. Shortreed MR, et al. Elucidating proteoform families from proteoform intact-mass and lysine-count measurements. J. Proteome Res. 2016;15:1213–1221. doi: 10.1021/acs.jproteome.5b01090. - DOI - PMC - PubMed
    1. Mann M, Kelleher NL. Precision proteomics: The case for high resolution and high mass accuracy. Proc. Natl Acad. Sci. USA. 2008;105:18132. doi: 10.1073/pnas.0800788105. - DOI - PMC - PubMed
    1. Shaw JB, et al. Complete protein characterization using top-down mass spectrometry and ultraviolet photodissociation. J. Am. Chem. Soc. 2013;135:12646–12651. doi: 10.1021/ja4029654. - DOI - PMC - PubMed
    1. Ge Y, et al. Top down characterization of larger proteins (45 kDa) by electron capture dissociation mass spectrometry. J. Am. Chem. Soc. 2002;124:672–678. doi: 10.1021/ja011335z. - DOI - PubMed

Publication types