. 2019 Jun 4:12:145.
doi: 10.3389/fnmol.2019.00145. eCollection 2019.

Scn2a Haploinsufficiency in Mice Suppresses Hippocampal Neuronal Excitability, Excitatory Synaptic Drive, and Long-Term Potentiation, and Spatial Learning and Memory

Affiliations

Scn2a Haploinsufficiency in Mice Suppresses Hippocampal Neuronal Excitability, Excitatory Synaptic Drive, and Long-Term Potentiation, and Spatial Learning and Memory

Wangyong Shin et al. Front Mol Neurosci. .

Abstract

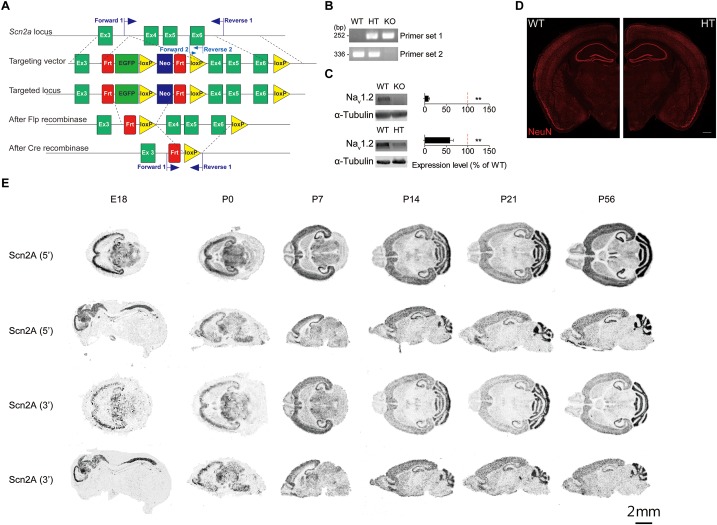
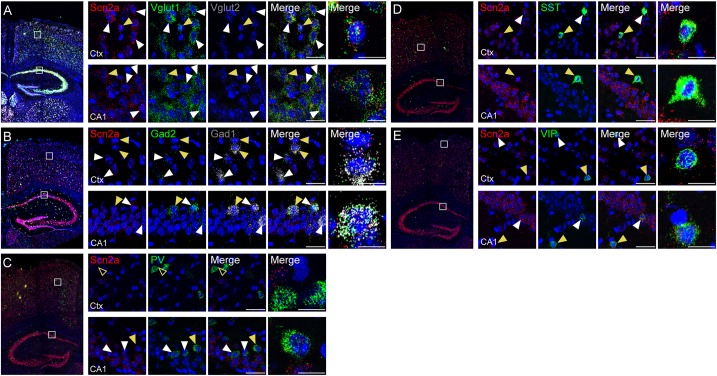
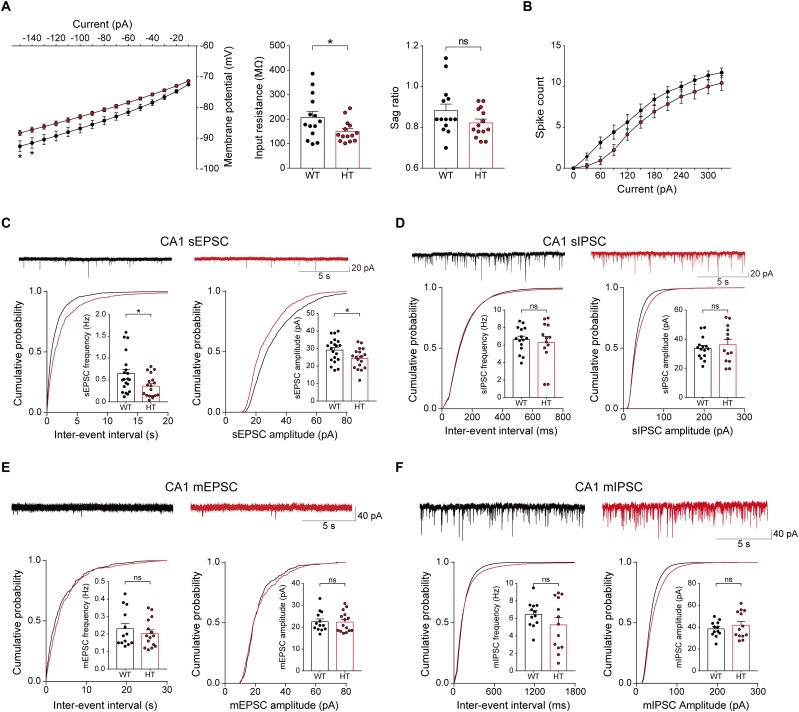
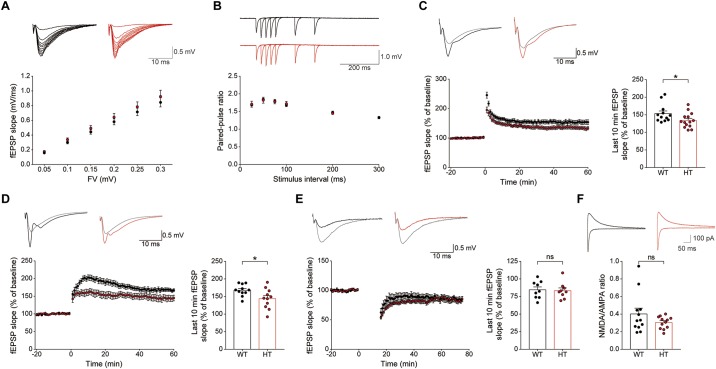
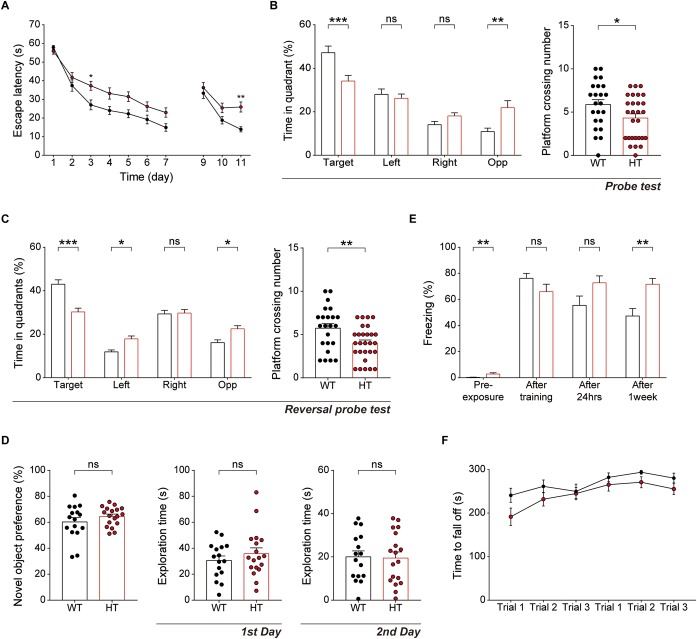
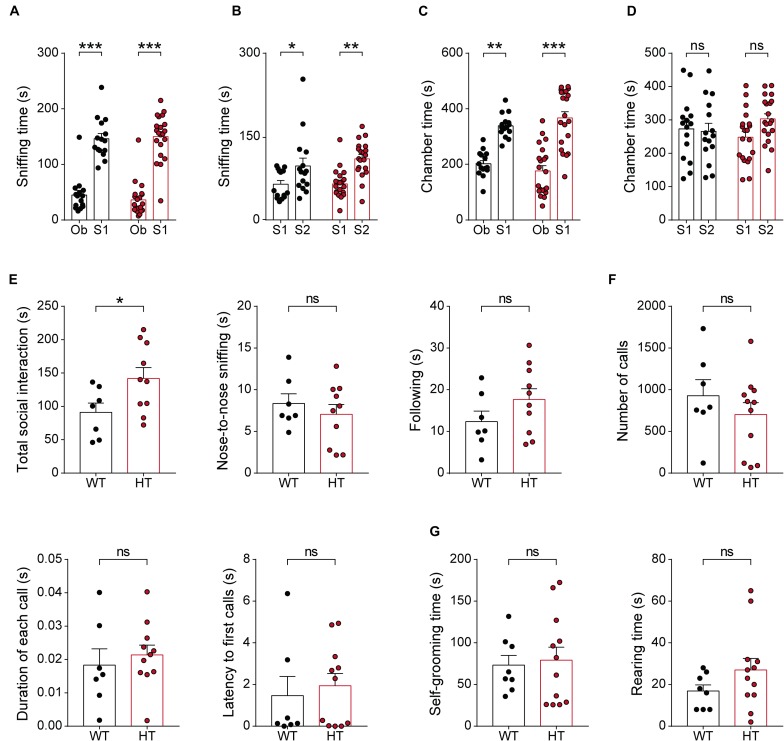
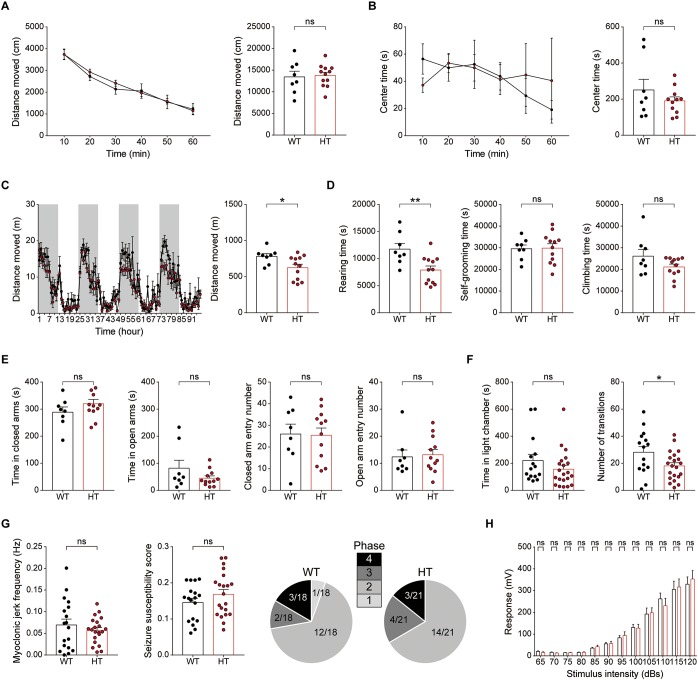
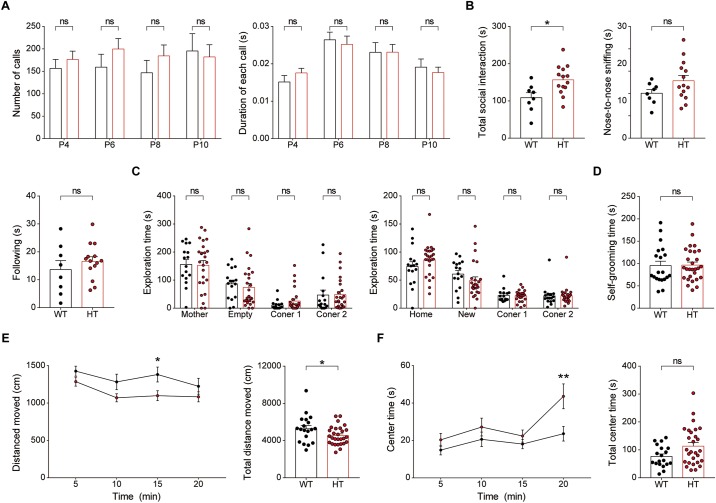
Nav1.2, a voltage-gated sodium channel subunit encoded by the Scn2a gene, has been implicated in various brain disorders, including epilepsy, autism spectrum disorder, intellectual disability, and schizophrenia. Nav1.2 is known to regulate the generation of action potentials in the axon initial segment and their propagation along axonal pathways. Nav1.2 also regulates synaptic integration and plasticity by promoting back-propagation of action potentials to dendrites, but whether Nav1.2 deletion in mice affects neuronal excitability, synaptic transmission, synaptic plasticity, and/or disease-related animal behaviors remains largely unclear. Here, we report that mice heterozygous for the Scn2a gene (Scn2a +/- mice) show decreased neuronal excitability and suppressed excitatory synaptic transmission in the presence of network activity in the hippocampus. In addition, Scn2a +/- mice show suppressed hippocampal long-term potentiation (LTP) in association with impaired spatial learning and memory, but show largely normal locomotor activity, anxiety-like behavior, social interaction, repetitive behavior, and whole-brain excitation. These results suggest that Nav1.2 regulates hippocampal neuronal excitability, excitatory synaptic drive, LTP, and spatial learning and memory in mice.

Keywords: autism; intellectual disability; learning and memory; neuronal excitability; schizophrenia; sodium channel; synaptic plasticity; synaptic transmission.


Figures

FIGURE 1
FIGURE 1
Generation of Scn2a+/- mice and characterization of Scn2a mRNA expression. (A) Schematic diagram of the strategy for targeting exons 4–6 of the Scn2a gene. The two sets of primers used for PCR genotyping are indicated. (B) PCR genotyping of Scn2a+/+, Scn2a+/-, and Scn2a-/- mice (2 months for WT and Scn2a+/-/HT mice; E20.5 for Scn2a-/-/KO mice). (C) Nav1.2 protein levels in whole-brain lysates from WT, Scn2a-/-, and Scn2a+/- mice (2 months for WT and Scn2a+/- mice; E20 for Scn2a-/- mice). Data are presented as means ± SEM. n = 4 mice, ∗∗P < 0.01, Student’s t-test). (D) Normal gross brain morphology in Scn2a+/- mice (3 months), as shown by staining for the neuronal marker, NeuN. Scale bar, 500 μm. (E) Distribution of Scn2a mRNA in various brain regions of WT mice at E18, P0, P7, P14, P21, and P56, revealed by isotope in situ hybridization. Note that the overall pattern of Scn2a mRNAs is similar using probes targeting 5′ and 3′ regions, although signals from the 5′ probe are stronger. Scale bar, 2 mm.
FIGURE 2
FIGURE 2
Expression of Scn2a mRNA in both glutamatergic and GABAergic neurons. (A,B) Expression of Scn2a mRNAs in Vglut1/2-positive glutamatergic neurons (A) and Gad1/2-positive GABAergic neurons (B) in the neocortex and hippocampus in the mouse brain (P56), as detected by fluorescence in situ hybridization. Coronal brain sections were triply stained for Scn2a, Vglut1/2 or Gad1/2, and DAPI (nuclear stain; blue). Images at right show enlarged views of white boxes in the images at left. Arrowheads indicate neurons that express both Scn2a and neuronal markers; cells indicated by yellow arrowheads were further enlarged to highlight coexpression of the markers. Scale bar, 20 and 10 μm for left and right scale bars, respectively, in each row. (C–E) Expression of Scn2a mRNA in PV-, SST-, or VIP-expressing GABAergic neurons in the neocortex and hippocampus in the mouse brain (P56), as detected by fluorescence in situ hybridization. Scale bar, 20 and 10 μm for left and right scale bars, respectively, in each row.
FIGURE 3
FIGURE 3
Decreased neuronal excitability and enhanced excitatory synaptic transmission in the presence of network activity in the Scn2a+/- hippocampus. (A,B) Suppressed intrinsic excitability in hippocampal CA1 pyramidal neurons of Scn2a+/- mice (3 weeks), as shown by the decrease in input resistance. Note that the sag ratio and current-spike relationship were normal, despite a decreasing trend. Data are presented as means ± SEM. n = 14 cells from 3 mice for WT and HT, P < 0.05, ns, not significant, two-way ANOVA with Sidak’s multiple comparison test for current–voltage curve and current–firing curve, Student’s t-test for input resistance and sag ratio. (C) Suppressed sEPSC frequency and amplitude in hippocampal CA1 neurons of Scn2a+/- mice (3 weeks). n = 20 cells from 4 mice for WT and 18 cells from 4 mice for HT, P < 0.05, Mann–Whitney test for frequency, Student’s t-test for amplitude. (D) Normal sIPSC frequency and amplitude in hippocampal CA1 neurons of Scn2a+/- mice (3 weeks). n = 15 cells from 3 mice for WT and 13 cells from 3 mice for HT, ns, not significant, Student’s t-test for frequency, Mann–Whitney test for amplitude. (E) Normal mEPSC frequency and amplitude in hippocampal CA1 neurons of Scn2a+/- mice (3 weeks). n = 13 cells from 3 mice for WT and 15 cells from 3 mice for HT, ns, not significant, Mann–Whitney test for frequency, Student’s t-test for amplitude. (F) Normal mIPSC frequency and amplitude in hippocampal CA1 neurons of Scn2a+/- mice (3 weeks). n = 12 cells from 3 mice for WT and 13 cells from 4 mice for HT, ns, not significant, Student’s t-test.
FIGURE 4
FIGURE 4
Scn2a+/- mice display suppressed LTP, but normal LTD. (A) Normal basal excitatory synaptic transmission at hippocampal SC-CA1 synapses in Scn2a+/- mice (P20–22), as shown by the input–output ratio of fEPSP slopes plotted against fiber volley (FV) amplitudes. Data are presented as means ± SEM. n = 10 slices from 3 mice for WT and HT, two-way ANOVA with Sidak’s multiple comparison test. (B) Normal paired-pulse facilitation at hippocampal SC-CA1 synapses of Scn2a+/- mice (P20–22), as shown by fEPSP slopes plotted against inter-stimulus intervals. n = 10 slices from 3 mice for WT and HT, two-way ANOVA with Sidak’s multiple comparison test. (C) Decreased LTP induced by high-frequency stimulation (100 Hz, 1 s) at hippocampal SC-CA1 synapses of Scn2a+/- mice (3 months). n = 12 slices from 6 mice for WT and 14 slices from 7 mice for HT, P < 0.05, Mann–Whitney test (last 10 min). (D) Decreased LTP induced by theta-burst stimulation (10 trains of 4 pulses at 100 Hz) at hippocampal SC-CA1 synapses of Scn2a+/- mice (3 months). n = 11 slices from 3 mice for WT and 11 slices from 4 mice for HT, P < 0.05, Student’s t-test (last 10 min). (E) Normal LTD induced by low-frequency stimulation (1 Hz, 15 min) at hippocampal SC-CA1 synapses of Scn2a+/- mice (P17–23). n = 9 slices from 4 mice for WT and 9 slices from 5 mice for HT, ns, not significant, Student’s t-test (last 10 min). (F) Normal NMDA/AMPA ratio at hippocampal SC-CA1 synapses of Scn2a+/- mice (P21–25), as shown by the ratio of NMDAR- to AMPAR-mediated EPSCs. n = 12 cells from 5 mice for WT and 12 cells from 4 mice for HT, ns, not significant, Mann–Whitney test.
FIGURE 5
FIGURE 5
Scn2a+/- mice show impaired spatial learning and memory and enhanced long-term fear memory. (A–C) Impaired spatial learning and memory in both the initial and reversal phases of the Morris water-maze test in Scn2a+/- mice (3–4 months), as shown by escape latency, time spent in quadrant, and number of exact platform crossings in the learning phase (day 1–7), reversal phase (day 9–11), and respective probe tests (days 8 and 12). Data are presented as means ± SEM. n = 23 mice for WT and 28 for HT, P < 0.05, ∗∗P < 0.01, ∗∗∗P < 0.001, ns, not significant, two-way ANOVA with Sidak’s multiple comparison test, Mann–Whitney test, and Student’s t-test. (D) Normal behavior of Scn2a+/- mice (2–3 months) in novel object-recognition test, as shown by novel-object preference. Note object exploration times are normal on both first and second days. n = 16 mice for WT and 18 for HT, ns, not significant, Student’s t-test. (E) Normal contextual fear memory acquisition and 24-h memory in Scn2a+/- mice (2–3 months), but enhanced 7-day fear memory in contextual fear-conditioning tests, as shown by freezing levels. Note that the 7-day experiment was performed directly after fear memory acquisition (no 24-h retrieval experiment). n = 13 mice for WT and 10 for HT, ∗∗P < 0.01, ns, not significant, Mann–Whitney test and Student’s t-test. (F) Normal motor learning of Scn2a+/- mice (3–4 months) in the rotarod test, as shown by latency to fall from the rotating rod. n = 8 mice for WT and 12 for HT, two-way ANOVA with Sidak’s multiple comparison test.
FIGURE 6
FIGURE 6
Scn2a+/- mice show abnormally enhanced direct social interaction but normal social approach, social communication, and repetitive behavior. (A–D) Normal social approach in Scn2a+/- mice (3–4 months) in the three-chamber test, as shown by time spent sniffing or in the chamber. Ob, object; S1, familiar stranger; S2, novel stranger. Data are presented as means ± SEM. n = 15 mice for WT and 21 for HT, P < 0.05, ∗∗P < 0.01, ∗∗∗P < 0.001, ns, not significant, two-way ANOVA with Sidak’s multiple comparison test. (E) Enhanced social interaction in Scn2a+/- mice (3–4 months) in the direct social-interaction test, using pairs of WT or Scn2a+/- mice. Note that, although the total social interaction was increased, a subset of individual parameters (nose-to-nose interaction and following) was normal in Scn2a+/- mice. n = 7 pairs of mice for WT and 10 for HT, P < 0.05, ns, not significant, Student’s t-test. (F) Normal USVs induced by a stranger female in Scn2a+/- mice (3–4 months), as shown by the number of USV calls, duration of each call, and latency to first call. n = 7 mice for WT and 11 for HT, ns, not significant, Student’s t-test and Mann–Whitney test. (G) Normal repetitive behaviors in Scn2a+/- mice (2–3 months), as shown by time spent self-grooming and rearing. n = 8 mice for WT and 12 for HT, ns, not significant, Student’s t-test.
FIGURE 7
FIGURE 7
Scn2a+/- mice show suppressed locomotion in a familiar environment, but normal anxiety-like behavior and susceptibility to induced seizure. (A,B) Normal locomotor activity of Scn2a+/- mice (2–3 months) in the open-field test. Data are presented as means ± SEM. n = 8 mice for WT and 11 for HT, ns, not significant, Two-way ANOVA with Sidak’s multiple comparison test, Student’s t-test and Mann–Whitney test. (C,D) Decreased distance moved and rearing time, but normal self-grooming and climbing, in Scn2a+/- mice (2–3 months) in the LABORAS test, in which mouse movements are continuously monitored for four consecutive days. Note that the extent of the decrease in distance moved became more evident as the time in LABORAS cages increased. The shaded regions indicate light-off periods. n = 8 mice for WT and 12 for HT, P < 0.05, ∗∗P < 0.01, ns, not significant, two-way ANOVA with Sidak’s multiple comparison test, and Student’s t-test. (E) Normal anxiety-like behavior of Scn2a+/- mice (2–3 months) in the elevated plus-maze test, as shown by time in closed/open arms and number of entries into each arm. n = 8 mice for WT and 12 for HT, ns, not significant, Student’s t-test and Mann–Whitney test. (F) Normal anxiety-like behavior of Scn2a+/- mice (2–3 months) in the light–dark chamber test, as shown by time spent in the light chamber. Note that the number of transitions into the light chamber was decreased, indicative of mild hypoactivity in the light–dark apparatus. n = 15 mice for WT and 21 for HT, P < 0.05, ns, not significant, Mann–Whitney test and Student’s t-test. (G) Normal susceptibility to PTZ-induced seizures in Scn2a+/- mice (4 months), as shown by myoclonic jerk frequency, seizure susceptibility score, and terminal seizure stage reached. n = 18 mice for WT and 21 for HT, ns, not significant, Student’s t-test, and Chi-square test. (H) Normal acoustic startle response of Scn2a+/- mice (2–3 months), as shown by the responses to different intensities of acoustic stimuli. n = 13 mice for WT and 10 for HT, ns, not significant, two-way ANOVA with Sidak’s multiple comparison test.
FIGURE 8
FIGURE 8
Newborn and juvenile Scn2a+/- mice show modestly increased direct social interaction and modestly decreased locomotion but normal social communication and mother-attachment behavior. (A) Normal mother-seeking USVs in newborn Scn2a+/- mice (P4–10), as shown by the number of USV calls, duration of each call, and latency to the first call. Data are presented as means ± SEM. n = 20 mice for WT and 27 for HT, ns, not significant, Mann–Whitney test. (B) Moderately increased direct social interaction (or juvenile play) in juvenile Scn2a+/- mice (3 weeks), as indicated by nose-to-nose sniffing. Note that the total social interaction is unaltered in the mutant mice n = 8 mice for WT and 14 for HT, P < 0.05, ns, not significant, Student’s t-test. (C) Normal mother-attachment behavior in juvenile Scn2a+/- mice (3 weeks). n = 16 mice for WT and 25 for HT, ns, not significant, two-way ANOVA with Sidak’s multiple comparison test. (D) Normal self-grooming in juvenile Scn2a+/- mice (3 weeks). n = 20 mice for WT and 28 for HT, ns, not significant, Student’s t-test. (E,F) Decreased locomotor activity and normal center time in juvenile Scn2a+/- mice (3 weeks) in the open-field test. n = 19 mice for WT and 28 for HT, P < 0.05, ∗∗P < 0.01, ns, not significant, two-way ANOVA with Sidak’s multiple comparison test and Student’s t-test.

Similar articles

Cited by

References

    1. Baasch A. L., Huning I., Gilissen C., Klepper J., Veltman J. A., Gillessen-Kaesbach G., et al. (2014). Exome sequencing identifies a de novo SCN2A mutation in a patient with intractable seizures, severe intellectual disability, optic atrophy, muscular hypotonia, and brain abnormalities. Epilepsia 55 e25–e29. 10.1111/epi.12554 - DOI - PubMed
    1. Bender K. J., Trussell L. O. (2012). The physiology of the axon initial segment. Annu. Rev. Neurosci. 35 249–265. 10.1146/annurev-neuro-062111-150339 - DOI - PubMed
    1. Ben-Shalom R., Keeshen C. M., Berrios K. N., An J. Y., Sanders S. J., Bender K. J. (2017). Opposing effects on NaV1.2 function underlie differences between SCN2A variants observed in individuals with autism spectrum disorder or infantile seizures. Biol. Psychiatry 82 224–232. 10.1016/j.biopsych.2017.01.009 - DOI - PMC - PubMed
    1. Berkovic S. F., Heron S. E., Giordano L., Marini C., Guerrini R., Kaplan R. E., et al. (2004). Benign familial neonatal-infantile seizures: characterization of a new sodium channelopathy. Ann. Neurol. 55 550–557. 10.1002/ana.20029 - DOI - PubMed
    1. Bi G. Q., Poo M. M. (1998). Synaptic modifications in cultured hippocampal neurons: dependence on spike timing, synaptic strength, and postsynaptic cell type. J. Neurosci. 18 10464–10472. 10.1523/jneurosci.18-24-10464.1998 - DOI - PMC - PubMed