. 2019 Jun 12:13:266.
doi: 10.3389/fncel.2019.00266. eCollection 2019.

Hedgehog Pathway Activation Alters Ciliary Signaling in Primary Hypothalamic Cultures

Affiliations

Hedgehog Pathway Activation Alters Ciliary Signaling in Primary Hypothalamic Cultures

Ruchi Bansal et al. Front Cell Neurosci. .

Abstract

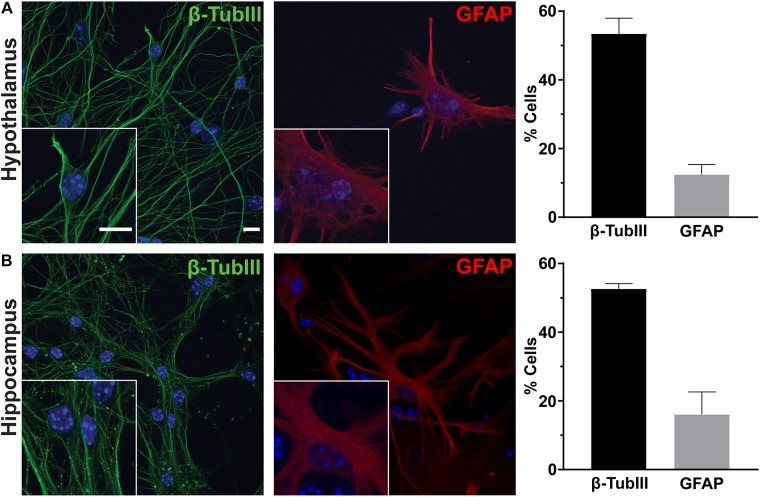
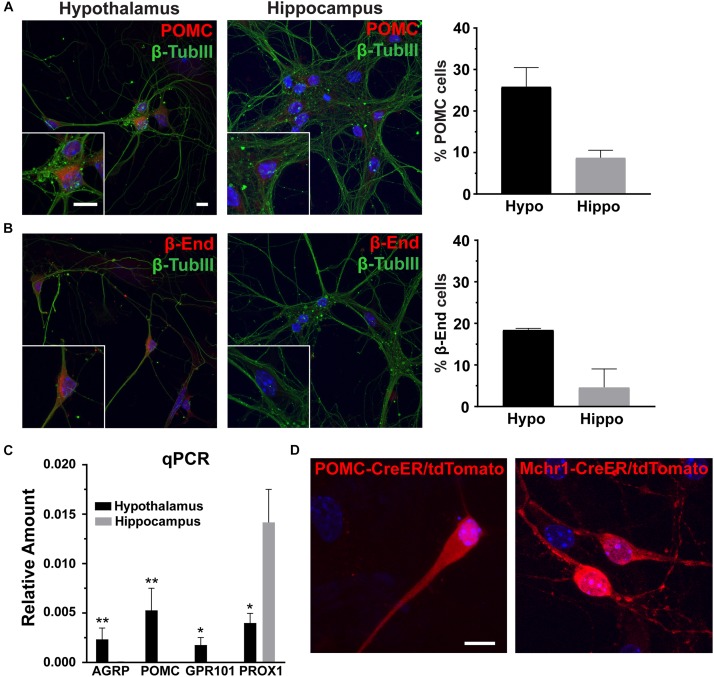
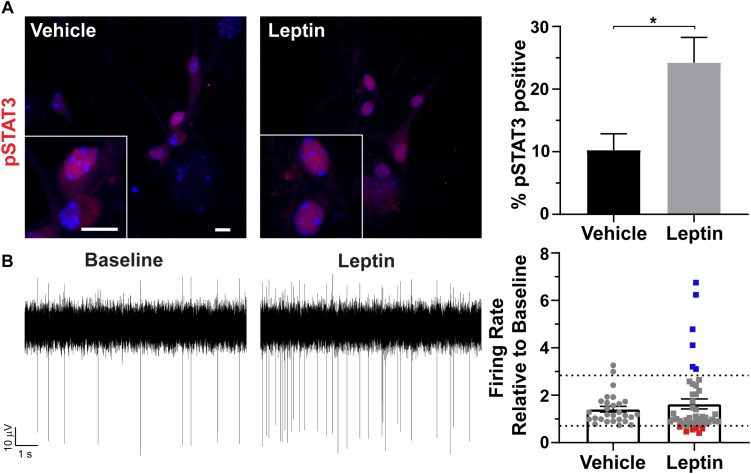
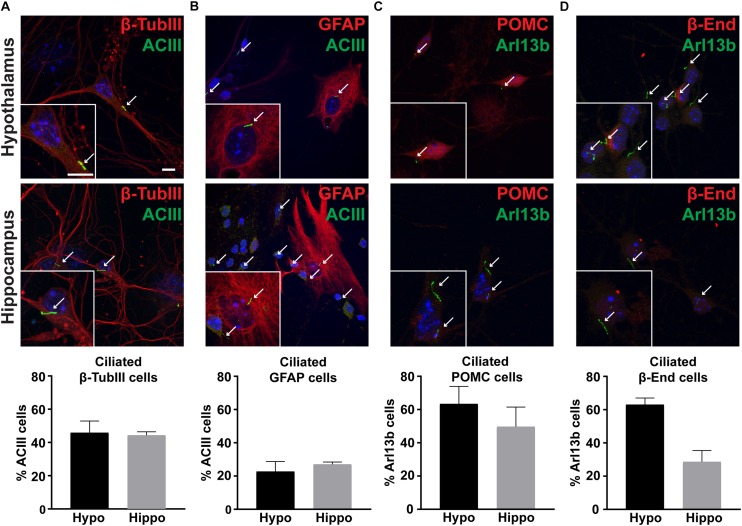
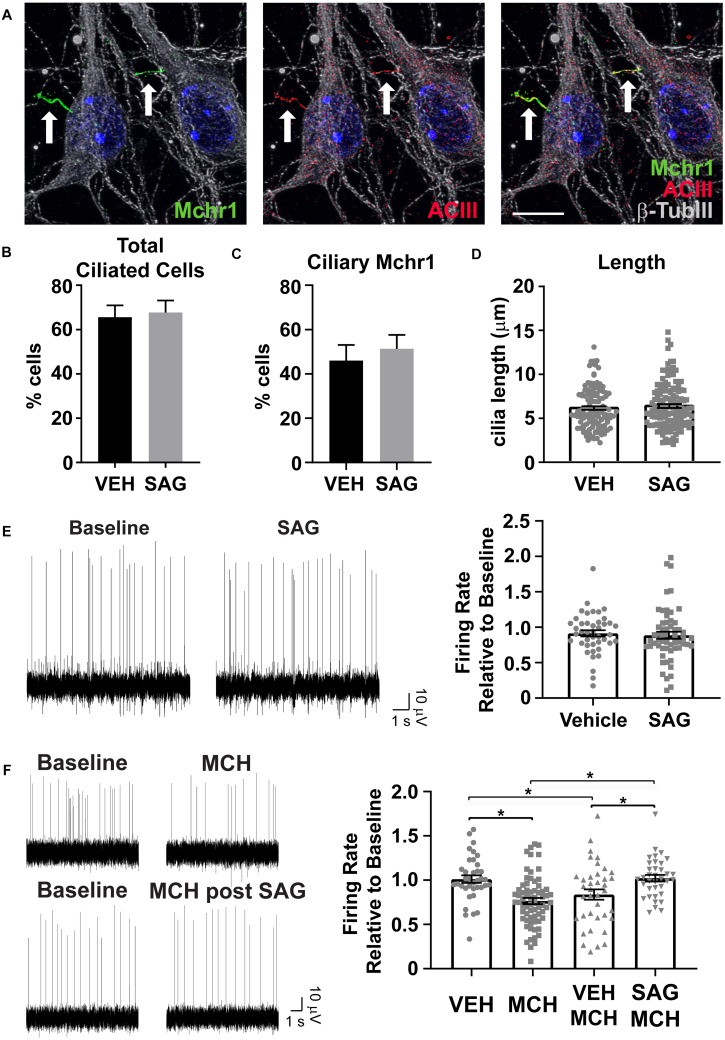
Primary cilia dysfunction has been associated with hyperphagia and obesity in both ciliopathy patients and mouse models of cilia perturbation. Neurons throughout the brain possess these solitary cellular appendages, including in the feeding centers of the hypothalamus. Several cell biology questions associated with primary neuronal cilia signaling are challenging to address in vivo. Here we utilize primary hypothalamic neuronal cultures to study ciliary signaling in relevant cell types. Importantly, these cultures contain neuronal populations critical for appetite and satiety such as pro-opiomelanocortin (POMC) and agouti related peptide (AgRP) expressing neurons and are thus useful for studying signaling involved in feeding behavior. Correspondingly, these cultured neurons also display electrophysiological activity and respond to both local and peripheral signals that act on the hypothalamus to influence feeding behaviors, such as leptin and melanin concentrating hormone (MCH). Interestingly, we found that cilia mediated hedgehog signaling, generally associated with developmental processes, can influence ciliary GPCR signaling (Mchr1) in terminally differentiated neurons. Specifically, pharmacological activation of the hedgehog-signaling pathway using the smoothened agonist, SAG, attenuated the ability of neurons to respond to ligands (MCH) of ciliary GPCRs. Understanding how the hedgehog pathway influences cilia GPCR signaling in terminally differentiated neurons could reveal the molecular mechanisms associated with clinical features of ciliopathies, such as hyperphagia-associated obesity.

Keywords: SAG; cilia; hedgehog signaling; hypothalamus; leptin; melanin concentrating hormone receptor 1; primary neuronal cultures; smoothened.


Figures

FIGURE 1
FIGURE 1
Hypothalamic and hippocampal culture content. Hypothalamic (A) and hippocampal (B) cultures from perinatal mice contain neurons [β-tubulin III (β-TubIII), green] and glia [glial fibrillary acidic protein (GFAP), red] after 7 days in culture. The percentage of cells positive for the associated stain divided by the total number of cells counted per hypothalamus or hippocampus is graphed as mean ± SEM. Hoechst stained nuclei are blue. Scale bars are 10 μm. Data collected from 3 hypothalamic and hippocampal samples from 3 experimental days. β-tubulin III positive cells/total hypothalamic nuclei: 336/628, GFAP positive cells/total hypothalamic nuclei: 126/647, β-tubulin III positive cells/total hippocampal nuclei: 323/613, and GFAP positive cells/total hippocampal nuclei: 108/617.
FIGURE 2
FIGURE 2
Hypothalamic characteristics in vitro. (A) Proopiomelanocortin (POMC, red) and (B) β-endorphin (β-End, red) staining in hippocampal and hypothalamic cultures co-stained for β-tubulin III (β-TubIII, green). Scale bars are 10 μm. Percentage of cells positive for POMC or β-endorphin divided by the total number of cells counted in the hypothalamus and hippocampus graphed as mean ±SEM. Data collected from 3 hypothalamic and hippocampal samples from 3 experimental days. POMC positive cells/total hypothalamic nuclei: 166/642, β-endorphin positive cells/total hypothalamic nuclei: 203/657, POMC positive cells/total hippocampal nuclei: 57/653, and β-endorphin positive cells/total hippocampal nuclei: 69/678. (C) Quantitative PCR (qPCR) analysis on total RNA isolated from day 7 hypothalamic and hippocampal cultures. Gene expression of agouti related peptide (AgRP), POMC, G protein-coupled receptor 101 (GPR101), and Prospero homeobox protein 1 (PROX1) relative to actin is graphed as mean ± SEM. *P < 0.05 and ∗∗P < 0.01 using a Students t-test. Data collected from 7 hypothalamic and hippocampal samples from 3 experimental days. (D) Neurons cultured from mice with hypothalamic inducible cre alleles (POMC-CreER and Mchr1-CreER) show the presence of reporter (tdTomato) expression in vitro upon 4-OH tamoxifen treatment. In all images Hoechst stained nuclei are blue and scale bars are 10 μm.
FIGURE 3
FIGURE 3
Hypothalamic specific responses to leptin in vitro. (A) Phosphorylation and nuclear localization of STAT3 (pSTAT3, red) following 30 min leptin (10 nM) treatment. Hoechst stained nuclei are blue and scale bars are 10 μm. Percent pSTAT3 positive cells in vehicle and leptin treated cultures divided by total number of cells counted is graphed as mean ± SEM. *P < 0.05 using a Student’s t-test. Data collected from 3 hypothalamic samples from 3 experimental days. pSTAT3 positive cells/total vehicle treated hypothalamic nuclei 34/333, pSTAT3 positive cells/total leptin treated hypothalamic nuclei 86/354. (B) Representative traces from one electrode showing the baseline activity and activity after 10 nM leptin addition. The change in firing rate relative to baseline is graphed as mean ± SEM for vehicle and leptin addition. Each point represents an active electrode. Dashed line indicates two time above and below the average of the vehicle bar. Leptin results in some electrodes displaying decreases (red squares), increases (blue squares), or no change (gray squares) in neuronal activity relative to baseline. Data collected from 4 hypothalamic samples from 3 experimental days.
FIGURE 4
FIGURE 4
Cultures possess primary cilia. (A) β-tubulin III (β-TubIII, red) stained neurons with adenylyl cyclase III (ACIII, green) positive cilia. (B) Glial fibrillary acidic protein (GFAP, red) stained astrocytes with adenylyl cyclase III (ACIII, green) positive cilia. (C) Proopiomelanocortin (POMC, red) expressing, and (D) β-endorphin (β-End, red) expressing neurons with ADP Ribosylation Factor Like GTPase 13B (Arl13b, green) positive cilia in both hypothalamic and hippocampal derived neurons. Hoechst stained nuclei are blue. Arrows indicate cilia. Scale bars are 10 μm. Percentage of cilia marker positive cells divided by the total number of associated cell type assessed per hypothalamus or hippocampus is graphed as mean ± SEM. Data collected from 3 hypothalamic and hippocampal samples from 3 experimental days. β-tubulin III cells with ACIII positive cilia/total hypothalamic β-tubulin III positive cells: 152/336, β-tubulin III cells with ACIII positive cilia/total hippocampal β-tubulin III positive cells: 160/323, GFAP cells with ACIII positive cilia/total hypothalamic GFAP positive cells: 32/126, GFAP cells with ACIII positive cilia/total hippocampal GFAP positive cells: 42/108, POMC cells with Arl13b positive cilia/total hypothalamic POMC positive cells: 100/166, POMC cells with Arl13b positive cilia/total hippocampal POMC positive cells: 28/57, β-endorphin cells with Arl13b positive cilia/total hypothalamic β-endorphin positive cells: 124/203, and β-endorphin cells with Arl13b positive cilia/total hippocampal β-endorphin positive cells: 37/69.
FIGURE 5
FIGURE 5
Hedgehog pathway agonism attenuates neuronal response to MCH. (A) Melanin concentrating hormone receptor 1 (Mchr1, green) localizes to primary cilia (ACIII, red) of cultured hypothalamic neurons labeled with β-tubulin III (β-TubIII, gray). Hoechst stained nuclei blue. Scale bar 10 μm. Arrows indicate cilia. (B) Cilia counts in hypothalamic cultures following 24 h SAG treatment. Percent cilia positive cells in vehicle and SAG treated cultures is graphed as mean ± SEM. Vehicle treated hypothalamic cultures: 121 ACIII positive cilia/189 total cells. SAG treated hypothalamic cultures: 127 ACIII positive cilia/189 total cells. (C) Mchr1 positive cilia following SAG treatment. Percent Mchr1 positive cilia in vehicle and SAG treated cultures are graphed as mean ± SEM. Vehicle treated hypothalamic cultures: 83 Mchr1 positive cilia/121 ACIII positive cilia. SAG treated hypothalamic cultures: 96 Mchr1 positive cilia/127 ACIII positive cilia. (D) Cilia length measurements. Graphed as mean ± SEM. Outliers were identified and removed using ROUT with Q = 1%. 121 cilia were measured following 24 h vehicle treatment and 127 cilia were measured following 24 h SAG treatment. (E) Representative traces from one electrode showing baseline activity and activity after addition 400 nM SAG. The change in firing relative to baseline is graphed as mean ± SEM for vehicle and SAG addition. (F) Representative traces from one electrode showing baseline activity and activity after addition of 1 μM MCH or MCH following 24 h pretreatment with 400 nM SAG. The change in firing relative to baseline is graphed as mean ± SEM for vehicle and peptide addition. Each point represents an active electrode. *P < 0.05 using an Ordinary one-way ANOVA with Tukey’s multiple comparisons test. Outliers were identified and removed using ROUT with Q = 1%. All data collected from 3 to 6 hypothalamic samples from 3 to 5 experimental days.

Similar articles

Cited by

References

    1. Andermann M. L., Lowell B. B. (2017). Toward a Wiring diagram understanding of appetite control. Neuron 95 757–778. 10.1016/j.neuron.2017.06.014 - DOI - PMC - PubMed
    1. Antal M. C., Bénardais K., Samama B., Auger C., Schini-Kerth V., Ghandour S., et al. (2017). Adenylate cyclase type iii is not a ubiquitous marker for all primary cilia during development. PLoS One 12:e0170756. 10.1371/journal.pone.0170756 - DOI - PMC - PubMed
    1. Arensdorf A. M., Marada S., Ogden S. K. (2016). Smoothened regulation: a tale of two signals. Trends Pharmacol. Sci. 37 62–72. 10.1016/j.tips.2015.09.001 - DOI - PMC - PubMed
    1. Banks A. S., Davis S. M., Bates S. H., Myers M. G., Jr. (2000). Activation of downstream signals by the long form of the leptin receptor. J. Biol. Chem. 275 14563–14572. 10.1074/jbc.275.19.14563 - DOI - PubMed
    1. Bardy C., van den Hurk M., Eames T., Marchand C., Hernandez R. V., Kellogg M., et al. (2015). Neuronal medium that supports basic synaptic functions and activity of human neurons in vitro. Proc. Natl. Acad. Sci. U.S.A. 112 E2725–E2734. - PMC - PubMed