. 2019 Jun 13:10:612.
doi: 10.3389/fphar.2019.00612. eCollection 2019.

Differential Effects of Purinergic Signaling in Gastric Cancer-Derived Cells Through P2Y and P2X Receptors

Affiliations

Differential Effects of Purinergic Signaling in Gastric Cancer-Derived Cells Through P2Y and P2X Receptors

María José Hevia et al. Front Pharmacol. .

Abstract

Gastric cancer (GC) is the one of the most prevalent cancers and one of the leading causes of cancer-induced deaths. Previously, we found that the expression of purinergic P2Y2 receptor (P2Y2R) is increased in GC samples as compared to adjacent healthy mucosa taken from GC-diagnosed patients. In this work, we studied in detail purinergic signaling in the gastric adenocarcinoma-derived cell lines: AGS, MKN-45, and MKN-74, and compared them to a nontumoral epithelial cell line: GES-1. In GC-derived cells, we detected the expression of several purinergic receptors, and found important differences as compared to GES-1 cells. Functional studies revealed a strong contribution of P2Y2Rs in intracellular calcium increases, elicited by adenosine-triphosphate (ATP), uridine-triphosphate (UTP), and the P2Y2R agonist MRS2768. Responses were preserved in the absence of extracellular calcium and inhibited by P2Y2R antagonists. In GES-1 cells, ATP and UTP induced similar responses and the combination of P2X and P2Y receptor antagonists was able to block them. Proliferation studies showed that ATP regulates AGS and MKN-74 cells in a biphasic manner, increasing cell proliferation at 10-100 μM, but inhibiting at 300 μM ATP. On the other hand, 1-300 μM UTP, a P2Y2R agonist, increased concentration-dependent cell proliferation. The effects of UTP and ATP were prevented by both wide-range and specific purinergic antagonists. In contrast, in GES-1 cells ATP only decreased cell proliferation in a concentration-dependent manner, and UTP had no effect. Notably, the isolated application of purinergic antagonists was sufficient to change the basal proliferation of AGS cells, indicating that nucleotides released by the cells can act as paracrine/autocrine signals. Finally, in tumor-derived biopsies, we found an increase of P2Y2R and a decrease in P2X4R expression; however, we found high variability between seven different biopsies and their respective adjacent healthy gastric mucosa. Even so, we found a correlation between the expression levels of P2Y2R and P2X4R and survival rates of GC patients. Taken together, these results demonstrate the involvement of different purinergic receptors and signaling in GC, and the pattern of expression changes in tumoral cells, and this change likely directs ATP and nucleotide signaling from antiproliferative effects in healthy tissues to proliferative effects in cancer.

Keywords: ATP; P2X receptor; P2Y receptor; gastric cancer; paracrine action; uridine triphosphate (UTP).


Figures
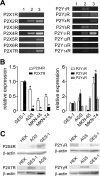
Figure 1
Figure 1
Purinergic receptor pattern expression in normal and cancer-derived cell lines. (A) Representative polymerase chain reaction (PCR) from total RNA obtained from AGS (2) or GES-1 (3) cells for P2X receptors (P2XRs) (left) and P2Y receptors (P2YRs) (right). Lane 1 represents a blank control; the data shown is representative of at least three separate experiments. (B) Summary of quantitative PCR (qPCR) experiments showing RNA levels of P2X4R and P2X7R (left graph) or P2Y1R, P2Y2R, and P2Y4R (right graph) in control GES-1 cells or in gastric cancer (GC)-derived AGS, MKN-45, or MKN-74 cells. *p < 0.05, Kruskal–Wallis and Dunn´s tests. (C) Western blot analysis for the expression of P2X4R, P2X7R, P2Y1R, P2Y2R, and β-actin in HEK293, AGS, and GES-1 cells. Blots are representative of three different experiments.
Figure 2
Figure 2
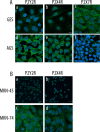
Protein expression of purinergic receptors in normal and cancer-derived cell lines. (A) Confocal images from GES-1 and AGS cells showing immunofluorescence for P2Y2R, P2X4R, and P2X7R; scale bar 10 µm. (B) Confocal images from MKN-45 and MKN-74 cells showing immunofluorescence for P2Y2R and P2X4R; scale bar 10 µm. In all cases the images shown are representative of three different samples.
Figure 3
Figure 3
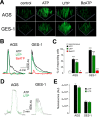
Purinergic receptor induced increases of intracellular calcium. (A) Representative 2.5D representation of ATP, UTP, or BzATP (100 μM) induced increases of [Ca2+]i in AGS and GES-1 cells. (B) Total increase of [Ca2+]i induced by ATP (black traces), UTP (green traces), and BzATP (red traces) in AGS and GES-1 cells, in four to six fields. (C) Percentage of responding cells for spontaneous activity (open bars), ATP (black bars), UTP (green bars), and BzATP (red bars). *p < 0.05; ***p < 0.001, ANOVA test, n = 4–11. (D) Representative recordings from single AGS or GES-1 cells showing the increase of [Ca2+]i induced by 100 µM ATP (black traces) or UTP (green traces). (E) Summary of the maximal relative fluorescence, measured in arbitrary units (AU) induced by ATP (black bars) or UTP (green bars) in AGS and GES-1 cells, n = 21–24.
Figure 4
Figure 4
Contribution of P2YRs and P2XRs to increases in [Ca2+]i. (A) 2.5D representations of AGS cells showing spontaneous (control) activity after the application of 100 µM ATP in the presence (upper images) or absence (lower images) of extracellular calcium. (B) Left, representative recordings from AGS cells showing the 100 µM ATP-induced spikes in the presence or in the absence of extracellular calcium. Right, summary of the maximal relative fluorescence and frequency of the ATP-induced spikes in the presence (black bars) or absence (open bars) of 2 mM extracellular Ca2+. (C) Representative recordings showing [Ca2+]i increases induced by 100 µM ATP alone (black traces) or together with BX430 (blue traces) or BX430 and ARC-118925XX (red trace).
Figure 5
Figure 5
Summary of the effects of ATP and UTP in the proliferation of gastric cell lines. Changes in cell proliferation assessed by cell viability in the absence or presence of 1–300 µM ATP (left graph) or UTP (right graph) for the AGS (red), GES-1 (green), MKN-45 (gray), or MKN-74 (purple) cells. *p < 0.05, Kruskal–Wallis and Dunn’s tests, n = 4–6.
Figure 6
Figure 6
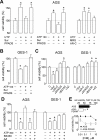
Effects of purinergic agonists and antagonist on the proliferation of AGS and GES-1 cells. (A) Summary of cell viability experiments on AGS cells showing the effect of: left graph, 100 µM UTP alone, or coapplied with 100 µM suramin (Sur) or 100 µM PPADS; middle graph, 100 µM ATP alone, or coapplied with 100 µM suramin (Sur) or 100 µM pyridoxal phospate-6-azo(benzene-2,4-disulfonic acid) (PPADS); right graph, effects of 100 µM UTP alone, 10 µM MRS2768 alone, or 100 µM UTP plus 10 µM ARC-118925XX, n = 4–7. (B) Summary of cell viability experiments in GES-1 cells showing the effect of 100 µM ATP alone, and coapplied with 100 µM suramin (Sur) or 100 µM PPADS, n = 3–5. (C) Summary of the effects of purinergic antagonists alone on cell viability applied to AGS (left) and GES-1 cells (right). The antagonists used were suramin (Sur) (100 µM), PPADS (100 µM), ARC-118925XX (AR-C) (10 µM), BX430 (10 µM), and AZ10606120 (AZ) (3 µM), n = 4–6. (D) Summary of cell viability experiments on AGS (left) and GES-1 (right) cells showing the effect of 300 µM ATP alone, and coapplied with 10 µM BX430 or 3 µM AZ10606120 (AZ), n = 3–4. (E) Effects of ivermectin (IVM) in AGS cell proliferation; lower graph: concentration–response curve for 1 nm–10 µM IVM and its effect on cell viability on control (closed circles) or P2X4R-overexpressing (open squares) AGS cells; upper graph: detail of cell viability in control (black bar) or P2X4R-overexpressing (open bar) AGS cells treated with 10 µM IVM, n = 3–4 in all cases *p < 0.05, Kruskal–Wallis and Dunn´s tests.
Figure 7
Figure 7
Changes in RNA levels of P2Y2R and P2X4R in human biopsies from normal and tumoral gastric tissues. (A) Summary of the changes of RNA measured by qPCR for P2Y2R (left graph) or P2X4R (right graph) taken from seven different patients diagnosed with GC. Changes in RNA levels were measured comparing the expression of the purinergic receptor in the tumor with its levels in the adjacent healthy gastric mucosa. *p < 0.05, paired t-test. (B) Individual changes in P2Y2R (left) and P2X4R (right) RNA levels in the seven different tumor biopsies analyzed. Dotted line represents the basal expression in adjacent healthy gastric mucosa.
Figure 8
Figure 8
Kaplan–Meier survival plots for high or low expression of P2Y2R and P2X4R in GC patients. Database was taken from the Kaplan–Meier Plotter Database (kmplot.com), from a total of 593 patients diagnosed with GC. Plots show the survival of patients with low (black line) and high (red line) expression of the P2Y2R (left plot) or the P2X4R (right plot)—number indicates surviving patients at 0, 50, 100, and 150 months.

References

    1. Abbracchio M. P., Burnstock G., Boeynaems J. M., Barnard E. A., Boyer J. L., Kennedy C., et al. (2006). International Union of Pharmacology LVIII: update on the P2Y G protein-coupled nucleotide receptors: from molecular mechanisms and pathophysiology to therapy. Pharmacol. Rev. 58, 281–341. 10.1124/pr.58.3.3 - DOI - PMC - PubMed
    1. Aquea G., Bresky G., Lancellotti D., Madariaga J. A., Zaffiri V., Urzua U., et al. (2014). Increased expression of P2RY2, CD248 and EphB1 in gastric cancers from Chilean patients. Asian Pac. J. Cancer Prev. 15, 1931–1936. 10.7314/APJCP.2014.15.5.1931 - DOI - PubMed
    1. Ase A. R., Honson N. S., Zaghdane H., Pfeifer T. A., Seguela P. (2015). Identification and characterization of a selective allosteric antagonist of human P2X4 receptor channels. Mol. Pharmacol. 87, 606–616. 10.1124/mol.114.096222 - DOI - PubMed
    1. Bertazza L., Mocellin S., Marchet A., Pilati P., Gabrieli J., Scalerta R., et al. (2009). Survivin gene levels in the peripheral blood of patients with gastric cancer independently predict survival. J. Transl. Med. 7, 111. 10.1186/1479-5876-7-111 - DOI - PMC - PubMed
    1. Burnstock G. (2013). Purinergic signalling: pathophysiology and therapeutic potential. Keio J. Med. 62, 63–73. 10.2302/kjm.2013-0003-RE - DOI - PubMed