. 2019 Jun 12:10:1321.
doi: 10.3389/fimmu.2019.01321. eCollection 2019.

L-Selectin Enhanced T Cells Improve the Efficacy of Cancer Immunotherapy

Affiliations

L-Selectin Enhanced T Cells Improve the Efficacy of Cancer Immunotherapy

H Angharad Watson et al. Front Immunol. .

Abstract

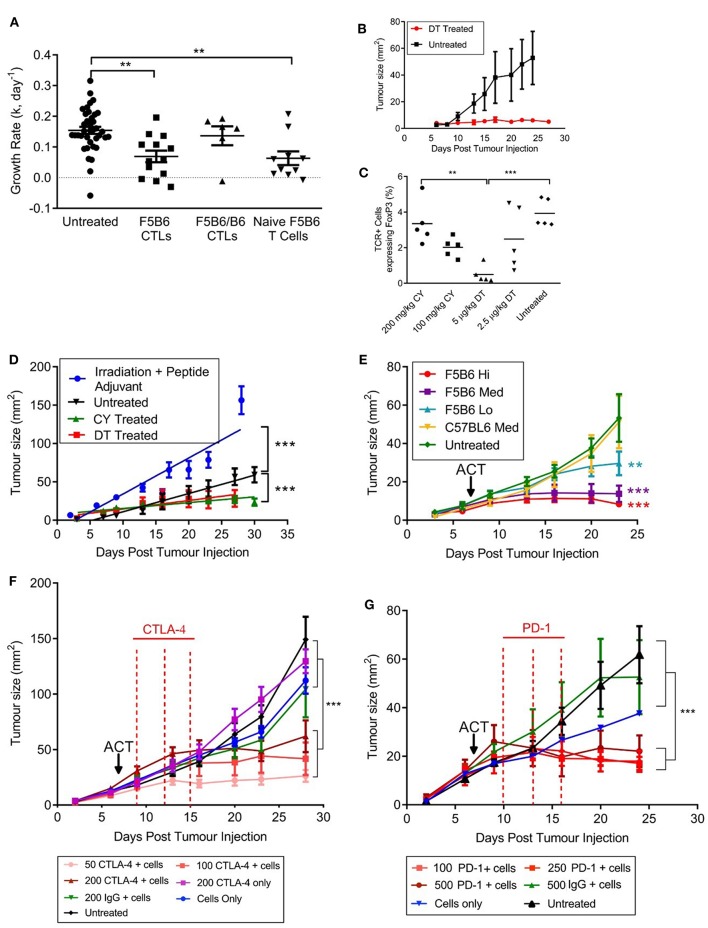
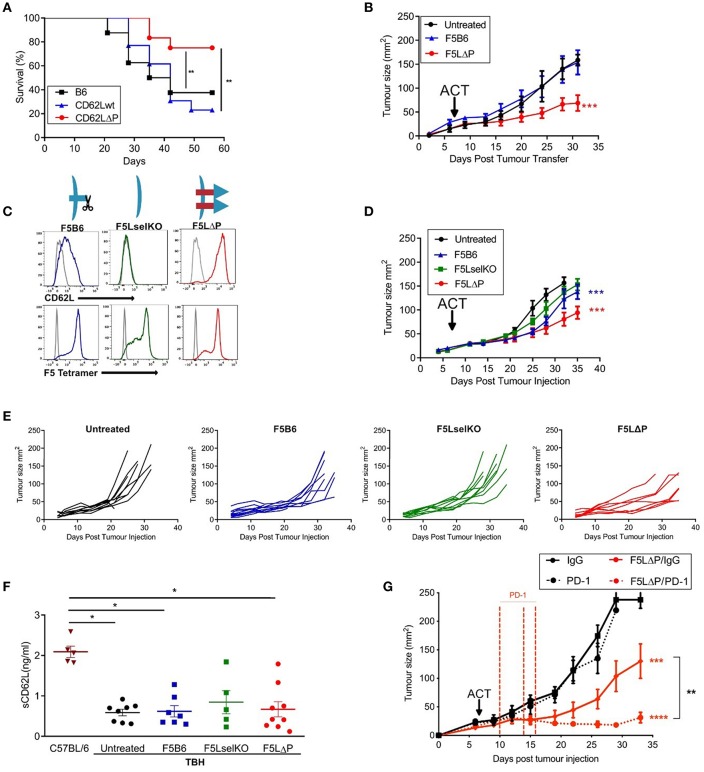
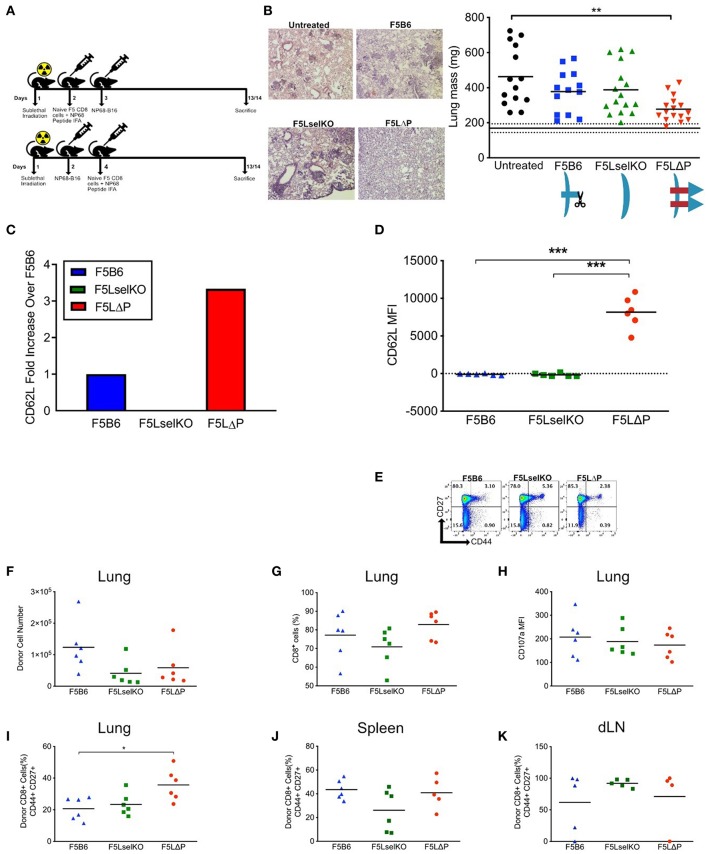
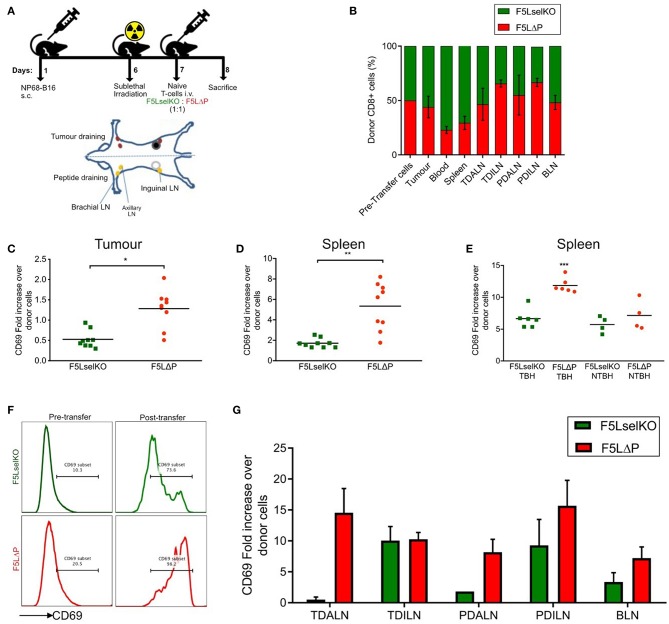
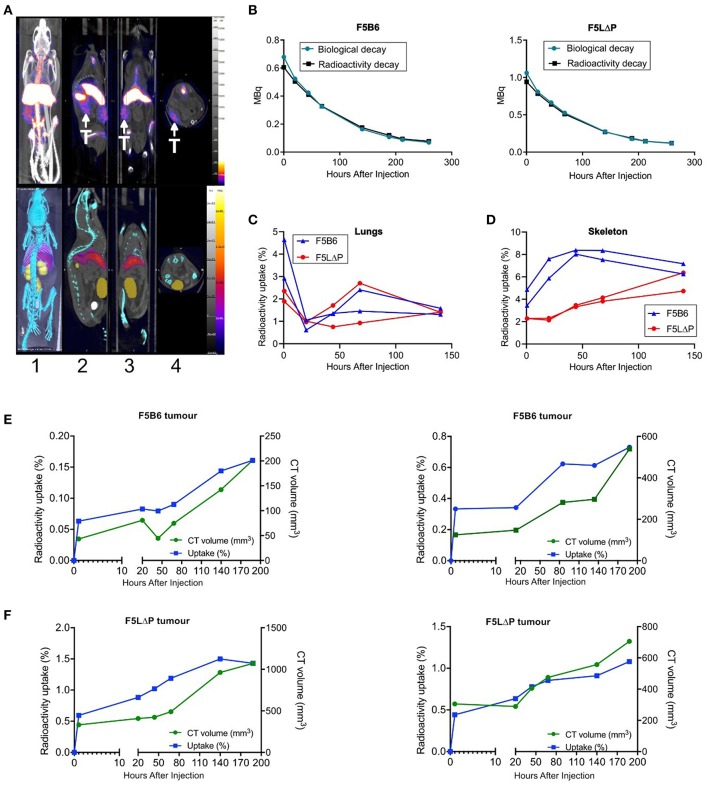
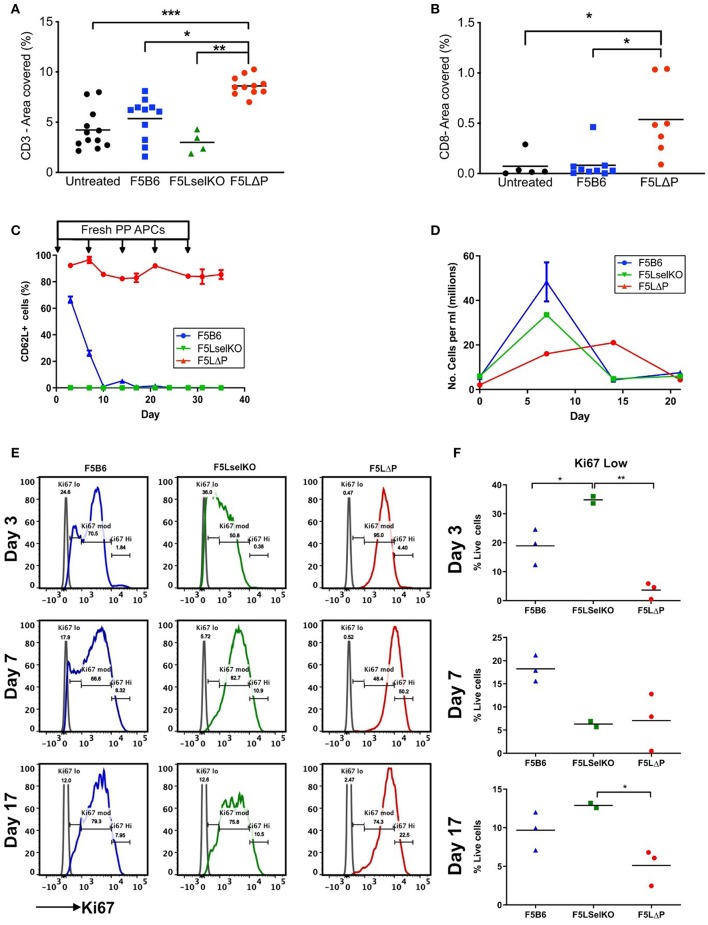
The homing molecule, L-selectin (CD62L), is commonly used as a T cell activation marker, since expression is downregulated following engagement of the T cell receptor. Studies in mice have shown that CD62L+ central memory T cells are better at controlling tumor growth than CD62L- effector memory T cells, while L-selectin knockout T cells are poor at controlling tumor growth. Here, we test the hypothesis that T cells expressing genetically modified forms of L-selectin that are maintained following T cell activation (L-selectin enhanced T cells) are better at controlling tumor growth than wild type T cells. Using mouse models of adoptive cell therapy, we show that L-selectin enhancement improves the efficacy of CD8+ T cells in controlling solid and disseminated tumor growth. L-selectin knockout T cells had no effect. Checkpoint blockade inhibitors synergized with wild type and L-selectin enhanced T cells but had no effect in the absence of T cell transfers. Reduced tumor growth by L-selectin enhanced T cells correlated with increased frequency of CD8+ tumor infiltrating T cells 21 days after commencing therapy. Longitudinal tracking of Zirconium-89 (89Zr) labeled T cells using PET-CT showed that transferred T cells localize to tumors within 1 h and accumulate over the following 7 days. L-selectin did not promote T cell homing to tumors within 18 h of transfer, however the early activation marker CD69 was upregulated on L-selectin positive but not L-selectin knockout T cells. L-selectin positive and L-selectin knockout T cells homed equally well to tumor-draining lymph nodes and spleens. CD69 expression was upregulated on both L-selectin positive and L-selectin knockout T cells but was significantly higher on L-selectin expressing T cells, particularly in the spleen. Clonal expansion of isolated L-selectin enhanced T cells was slower, and L-selectin was linked to expression of proliferation marker Ki67. Together these findings demonstrate that maintaining L-selectin expression on tumor-specific T cells offers an advantage in mouse models of cancer immunotherapy. The beneficial role of L-selectin is unrelated to its' well-known role in T cell homing and, instead, linked to activation of therapeutic T cells inside tumors. These findings suggest that L-selectin may benefit clinical applications in T cell selection for cancer therapy and for modifying CAR-T cells to broaden their clinical scope.

Keywords: L-selectin/CD62L; T cells; adoptive T cell therapy; cancer immunotherapy; melanoma.


Figures

Figure 1
Figure 1
An immunogenic solid tumor model in mice. (A) B16 melanoma cells expressing the NP68 antigen were transplanted subcutaneously into immunocompetent mice. Seven days after tumor transfer, mice were treated intravenously with either naïve CD8+ T cells carrying the F5 TCR, or CD8+ T cells activated in vitro with NP68 peptide (CTLs). F5B6 cells are homozygous and F5B6/B6 cells are hemizygous for the F5 TCR. Growth rates of tumors over time were measured in two dimensions and a “k” value was calculated. Data from more than one experiment. Scatter plots show individual mice and bars show means and SEM. (Untreated, n = 41, F5B6 CTLs, n = 14; F5B6/B6 CTLs, n = 6; naïve F5B6 T cells, n = 10). (B) NP68-B16 cells were transplanted into FoxP3DTR mice, and 7 days following tumor transfer, half the mice were treated with 5 μg/kg DT diphtheria toxin (DT) every 3 days for 2 weeks, n = 6. (C) NP68-B16 cells were transplanted into FoxP3DTR mice, and 7 days following tumor transfer mice were treated with either 5 μg/kg DT, 2.5 μg/kg DT, 200 mg/kg cyclophosphamide (CY) or 100 mg/kg cyclophosphamide. After 7 days of treatment, peripheral blood was sampled from the tail vein, and the percentage of cells positive for TCR and FoxP3 was enumerated by flow cytometry. Scatter plots show individual mice and bars show means. (D) Tumor growth rates in mice receiving different host conditioning regimes. Mice were either untreated or conditioned 7 days following tumor transfer by sublethal irradiation and peptide adjuvant (C57BL/6 hosts), CY or DT treatment (FoxP3DTR hosts), n = 10–14. Data from more than one experiment. Differences in tumor growth rate were calculated by linear regression and significances indicate differences in slope. ***P ≤ 0.001. (E) C57BL/6 mice with NP68-B16 tumors established for 7 days were treated with sublethal irradiation (597cGy) and peptide adjuvant together with naïve CD8+ T cells carrying the F5 TCR or polyclonal T cells (C57BL6). T cell doses were 5 × 104 = Lo; 2.25 × 105 = Med; 5 × 105 = High; n = 7–8. (F) C57BL/6 mice with NP68-B16 tumors established for 7 days were treated with sublethal irradiation (597cGy) and peptide adjuvant together with 2.25 × 10⁵ naïve CD8+ T cells carrying the F5 TCR in addition to treatment with anti-CTLA-4 antibody on days 9, 12, and 15 post tumor transfer, n = 8. (G) C57BL/6 mice with NP68-B16 tumors established for 7 days were treated with sublethal irradiation (597cGy) and peptide adjuvant together with 5 × 10⁴ naïve CD8+ T cells carrying the F5 TCR in addition to treatment with anti-PD-1 antibody at 10, 13, and 16 days post tumor transfer, n = 5–9. (A,C) Significance was calculated using one-way ANOVA with Tukey's multiple comparisons test. ***P ≤ 0.001, **P < 0.01. (D–G) Differences in tumor growth rate were calculated by linear regression and significances indicate differences in slope compared to untreated groups. **P ≤ 0.01, ***P ≤ 0.001.
Figure 2
Figure 2
L-selectin enhanced T cells expressing gain-of-function L-selectin exhibit improved control of solid tumor growth. (A) B16F10 melanomas were grown subcutaneously in unmanipulated C57BL/6 (B6) mice or transgenic mice expressing either wildtype (CD62Lwt) or mutant (CD62LΔP) L-selectin and tumor growth measured in the absence of host conditioning. Data represent the survival of mice with tumors ≥ 200 mm3. n = 11–13 mice per group. (B) C57BL/6 mice with NP68-B16 tumors established for 7 days were treated with sublethal irradiation (597cGy) and peptide adjuvant together with 5 × 10⁵ naïve CD8+ T cells carrying the F5 TCR and either endogenous WT (F5B6) or gain-of-function transgenic L-selectin/CD62L (F5LΔP), n = 7–8. The untreated control group for this experiment has been published previously (22). The experiment was a multi-arm study, with a shared control group, for the purposes of Replacement, Refinement and Reduction of Animals in Research in the UK (3Rs). The F5 T cell-treated groups have not been published previously. (C) Flow cytometric analysis of CD8+ T cells prior to adoptive transfer, indicating levels of CD62L and transgenic F5 TCR. Gray histograms are background staining. Graphics show L-selectin expression and shedding in different T cell populations. (D) Effect of the F5 T cell populations shown in (C) on NP68-B16 tumors established for 7 days and conditioned with sublethal irradiation and peptide adjuvant, n = 10. (E) Tumor growth curves for individual animals in experiment (D). (F) Soluble L-selectin in naïve C57BL/6 mice and tumor-bearing hosts (TBH) without (untreated) and with F5 T cell therapy. Symbols are data from individual mice. Results are mean + SEM. Significance tested using one-way ANOVA and Tukey's multiple comparison test. *P < 0.05. (G) Synergy between checkpoint blockade inhibition and L-selectin expressing T cells. Effect of F5LΔP T cells with and without anti-PD1 therapy (n = 8). Differences in tumor growth rate compared to untreated groups and between treatment groups were calculated by linear regression. *P ≤ 0.05, **P ≤ 0.01, ***P ≤ 0.001.
Figure 3
Figure 3
L-selectin enhanced T cells expressing gain-of-function L-selectin exhibit improved control of disseminated tumor growth. (A) Experimental protocol schematic. Both NP68-B16 tumor cells and naïve CD8+ cells were introduced via intravenous injection. (B) Tumor load measured by representage images of H&E stained lung sections and total lung mass. Data are pooled from more than one experiment. Symbols show individual mice and bars show means. Solid and dashed black lines show mean lung weight ± SD in age- and sex-matched naïve mice. Graphic shows L-selectin expression and shedding in different T cell populations. (C) Fold increase in expression of CD62L on F5LΔP naïve CD8+ T cells compared to F5B6 and F5LselKO CD8+ T cells. (D) CD62L expression of donor T cells recovered from the lungs of tumor bearing hosts on day 14, measured by mean fluorescence intensity. (E) CD44 and CD27 expression on donor CD8+ T cells prior to adoptive transfer. (F,G) Donor cells recovered from tumor-bearing lungs, by total number (F) and percentage CD8+ cells (G). (H) Expression of CD107a on donor T cells recovered from tumor-bearing lungs, measured by mean fluorescence intensity. (I) Percentage of donor T cells recovered from tumor-bearing lungs that are positive for CD44 and CD27. (J) Percentage of donor T cells recovered from spleen that are positive for CD44 and CD27. (K) Percentage of donor T cells recovered from the lung-draining lymph nodes that are positive for CD44 and CD27. (B,D,F–K) Significance was calculated using one-way ANOVA with Tukey's multiple comparisons test. ***P ≤ 0.001, **P ≤ 0.01, *P ≤ 0.05.
Figure 4
Figure 4
L-selectin dependent T cell homing and activation in tumor bearing mice. (A) Schematic of in vivo homing study and the location of lymph nodes in relation to tumor and peptide adjuvant injections. Diagram is of ventral view of mice showing various LNs. (B) Competitive homing of L-selectin sufficient (F5LΔP) and L-selectin deficient (F5LselKO) naïve T cells. T cells were allowed to home for 18 h before being recovered and analyzed by flow cytometry based on expression of F5 and L-selectin transgenes. Values are normalized to a total donor cell population of 100%. TDALN, tumor draining axillary lymph node; TDILN, tumor draining inguinal lymph node; PDALN, peptide draining axillary lymph node; PDILN, peptide draining inguinal lymph node; BLN, brachial lymph node. (C–G) Expression of activation marker CD69 on donor T cells recovered from tumor, spleen and LN calculated as fold increase over pre-transfer expression. Pre-transfer CD69 MFI values were 1,580 for F5LselKO cells and 1,664 for F5LΔP cells. (C) CD69 expression levels on donor T cells recovered from tumors of mice 18 h after injection. (D) CD69 expression levels on donor T cells recovered from spleens of tumor-bearing hosts after 18 h. (E) Comparison of CD69 expression on donor cells recovered from the spleens of tumor-bearing hosts (TBH) and non-TBH after 18 h, in a competitive homing study similar to that described in (A). (F) Representative plots showing CD69 expression on donor T cell pre-transfer to tumor bearing mice and following isolation from spleens of tumor-bearing mice (post-transfer). Percentages of CD69 positive donor T cells are shown. (G) Comparison of CD69 expression on donor cells recovered from the LN of tumor-bearing hosts after 18 h, in a competitive homing study similar to that described in (A). (B,G) Bars show means ± SEM (n = 5). (B–E,G) Significance was calculated using two-way ANOVA and multiple t-test. ***P ≤ 0.001, **P ≤ 0.01, *P ≤ 0.05.
Figure 5
Figure 5
Longitudinal tracking of 89Zr labelled T cells in tumor bearing mice using PET-CT. (A) Representative PET-CT images of NP68-B16 tumor bearing B6 mice 5 days after intravenous injection of 89Zr labeled T cells. T, tumor. Image orientations: 1, Maximum intensity projection; 2, Sagittal; 3, Coronal; 4, Transverse. (B) Representative time-activity curves from dosimeter quantification of 89Zr in the whole mouse overlaid with predicted radioactive decay of 89Zr in recipients of F5B6 (left) and F5LΔP (right) T cells. (C,D) Time-activity curves from image-based quantification of 89Zr in the lungs (C) and skeletons (D) of 2 mice receiving F5B6 (blue) or F5LΔP (red) T cells expressed as percentage of total 89Zr in the mouse at each timepoint. The earliest time point in (B–D) is 1 h after injection. (E,F) Time-activity curves from image-based quantification of 89Zr in tumors expressed as percentage of total 89Zr in the mouse (blue line) overlaid with tumor size measured by CT (volume; green line). Graphs show overlaid curves from each of two mice receiving either F5B6 (E) or F5LΔP (F) T cells.
Figure 6
Figure 6
Impact of L-selectin on TILs and T cell proliferation ex vivo. (A,B) Subcutaneous tumors were fixed in formalin and embedded in paraffin. Five micrometer sections were stained for CD3 (A) and CD8 (B) and images analyzed using Fuji Image J software. Each symbol represents % area stained in tumors from single mice receiving no T cells (untreated), T cells expressing endogenous L-selectin (F5B6), no L-selectin (F5 LselKO), or enhanced L-selectin (F5LΔP). Data are pooled from more than one experiment conducted under identical conditions. Bars show means (Untreated, n = 5–12, F5B6, n = 9–11; F5LselKO, n = 4; F5LΔP, n = 7–10). (C) CD8+ T cells from F5B6, F5LΔP, and F5LselKO mice were stimulated in vitro on NP68-peptide pulsed APCs, with restimulation every 7 days. Every 3 days, a sample of cells was collected, and analyzed by flow cytometry for a range of markers, including CD62L, n = 2–3. (D) Total live cells were enumerated by haemocytometer at each timepoint. (E) The proliferation marker Ki67 was compared on the same cell populations at days 3, 7, and 17. (F) The frequency of Ki67lo cells at each time point. (A,B,F) Significance was calculated using one-way ANOVA with Tukey's multiple comparisons test. ***P ≤ 0.001, **P ≤ 0.01, *P ≤ 0.05.

Similar articles

Cited by

References

    1. Poole RM. Pembrolizumab: first global approval. Drugs. (2014) 74:1973–81. 10.1007/s40265-014-0314-5 - DOI - PubMed
    1. Hodi FS, O'Day SJ, McDermott DF, Weber RW, Sosman JA, Haanen JB, et al. . Improved survival with ipilimumab in patients with metastatic melanoma. N Engl J Med. (2010) 363:711–23. 10.1056/NEJMoa1003466 - DOI - PMC - PubMed
    1. Wolchok JD, Kluger H, Callahan MK, Postow MA, Rizvi NA, Lesokhin AM, et al. . Nivolumab plus ipilimumab in advanced melanoma. N Engl J Med. (2013) 369:122–33. 10.1056/NEJMoa1302369 - DOI - PMC - PubMed
    1. Lawrence MS, Stojanov P, Polak P, Kryukov GV, Cibulskis K, Sivachenko A, et al. . Mutational heterogeneity in cancer and the search for new cancer-associated genes. Nature. (2013) 499:214–8. 10.1038/nature12213 - DOI - PMC - PubMed
    1. Aleksic M, Liddy N, Molloy PE, Pumphrey N, Vuidepot A, Chang KM, et al. . Different affinity windows for virus and cancer-specific T-cell receptors: implications for therapeutic strategies. Eur J Immunol. (2012) 42:3174–9. 10.1002/eji.201242606 - DOI - PMC - PubMed

Publication types