. 2019 Jun 12:10:1351.
doi: 10.3389/fimmu.2019.01351. eCollection 2019.

Lysine-Specific Histone Demethylase 1A Regulates Macrophage Polarization and Checkpoint Molecules in the Tumor Microenvironment of Triple-Negative Breast Cancer

Affiliations

Lysine-Specific Histone Demethylase 1A Regulates Macrophage Polarization and Checkpoint Molecules in the Tumor Microenvironment of Triple-Negative Breast Cancer

Abel H Y Tan et al. Front Immunol. .

Abstract

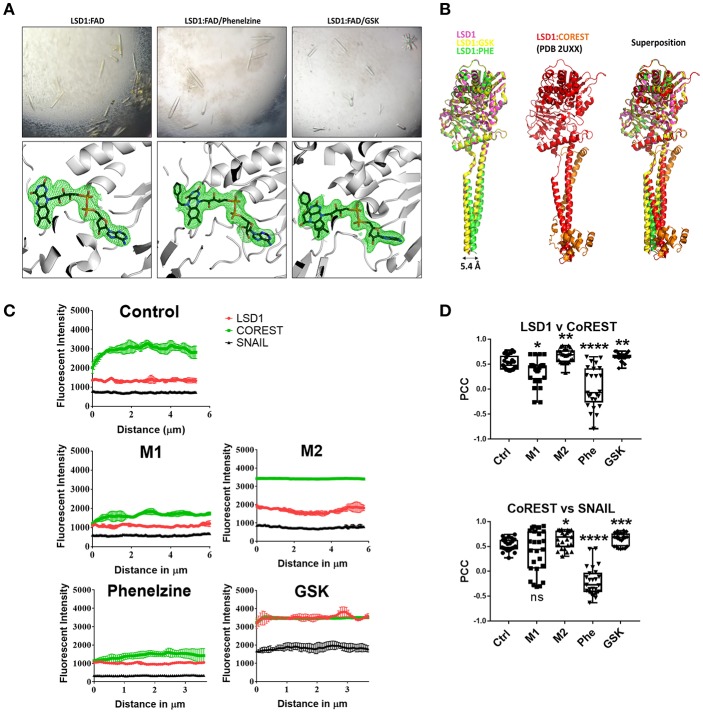
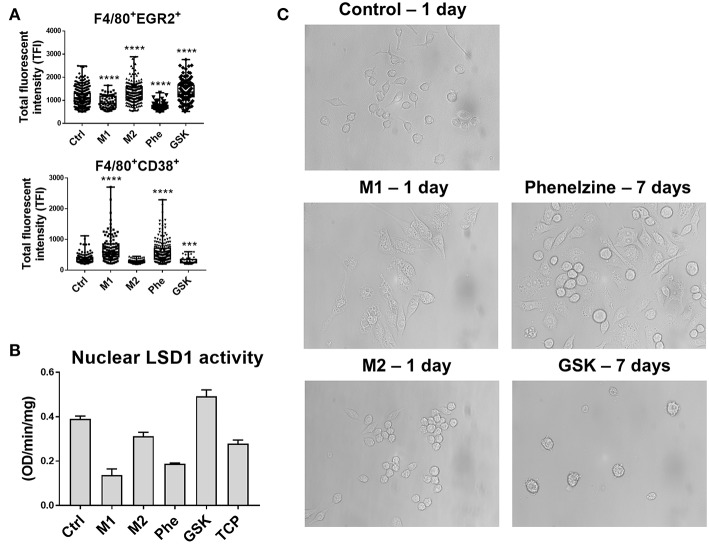
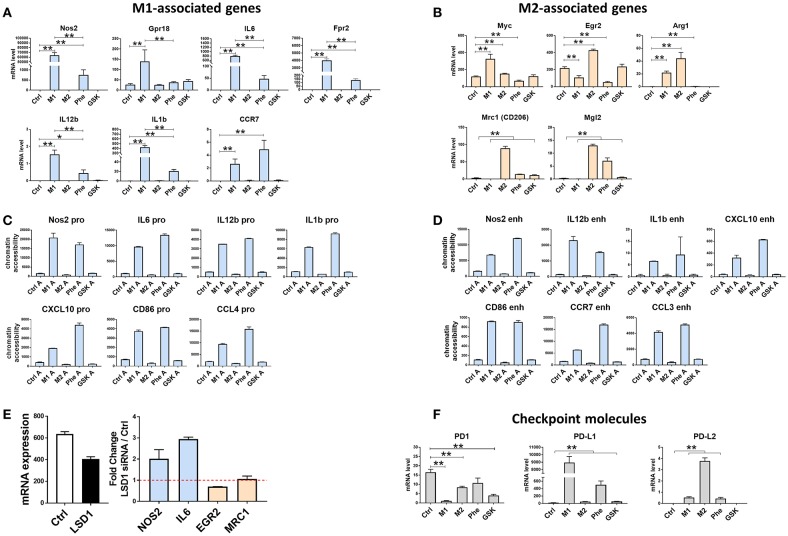
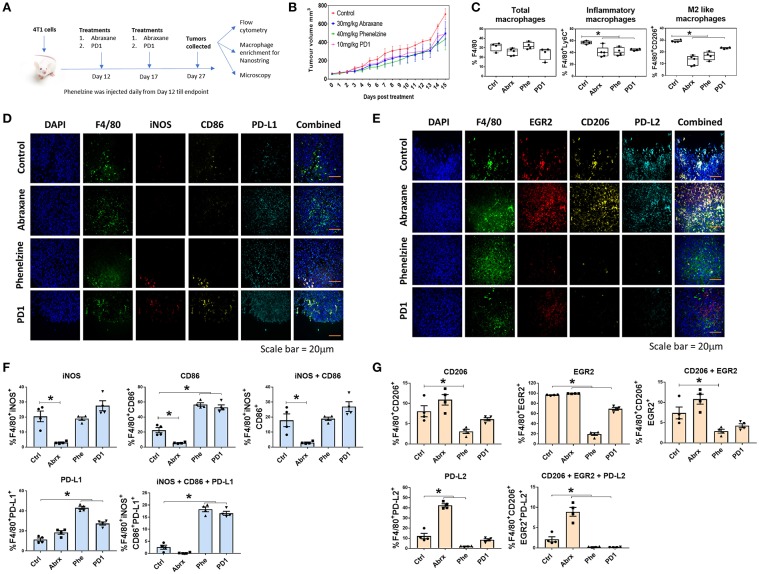
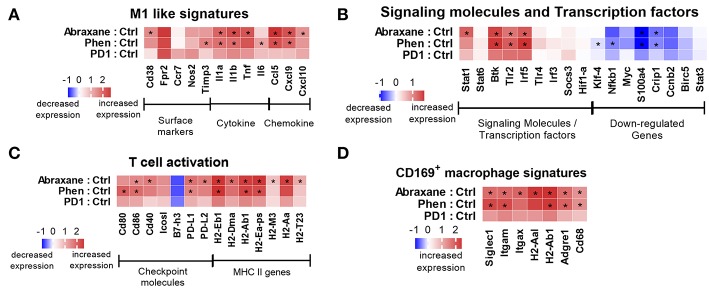
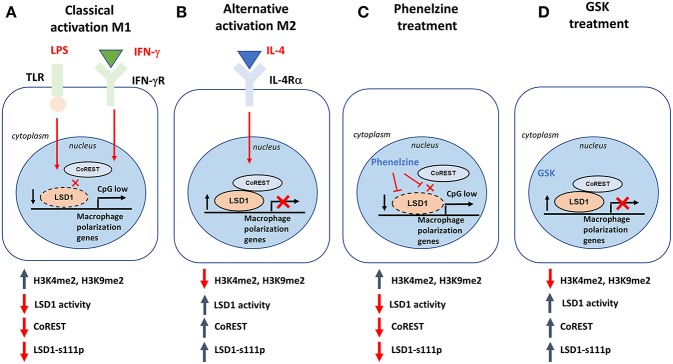
Macrophages play an important role in regulating the tumor microenvironment (TME). Here we show that classical (M1) macrophage polarization reduced expression of LSD1, nuclear REST corepressor 1 (CoREST), and the zinc finger protein SNAIL. The LSD1 inhibitor phenelzine targeted both the flavin adenine dinucleotide (FAD) and CoREST binding domains of LSD1, unlike the LSD1 inhibitor GSK2879552, which only targeted the FAD domain. Phenelzine treatment reduced nuclear demethylase activity and increased transcription and expression of M1-like signatures both in vitro and in a murine triple-negative breast cancer model. Overall, the LSD1 inhibitors phenelzine and GSK2879552 are useful tools for dissecting the contribution of LSD1 demethylase activity and the nuclear LSD1-CoREST complex to switching macrophage polarization programs. These findings suggest that inhibitors must have dual FAD and CoREST targeting abilities to successfully initiate or prime macrophages toward an anti-tumor M1-like phenotype in triple-negative breast cancer.

Keywords: CoREST; LSD1; breast cancer; epigenetics; macrophage polarization; tumor associated macrophages; tumor microenvironment.


Figures

Figure 1
Figure 1
Phenelzine targets the FAD domain of LSD1 and potentially disrupts the LSD1/CoREST axis resulting in destabilization of LSD1 and its nuclear activity. (A) LSD1 protein crystals (top panel) grown in the absence (left) and presence of phenelzine (middle) and GSK2879552 (right). In the absence of inhibitors, strong density (bottom panels) was observed consistent with the FAD cofactor (shown as sticks colored with carbons black, nitrogen blue, oxygen red, and phosphate orange). The map is a simulated annealed omit map for FAD contoured at 2.5 sigma. LSD1 is colored gray and shown in cartoon mode. The FAD modifications by phenelzine (middle) and GSK (right) are supported by strong density, with corresponding maps and colors as per LSD1:FAD. (B) Structural superposition of LSD1 in the absence and presence of phenelzine and GSK. The structures solved in this study (left panel), LSD1 alone (pink) (PDB 6NQM), LSD1:GSK (yellow) (PDB 6NQU), and LSD1:phenelzine (green) (PDB 6NR5) are represented in cartoon mode. These structures are superimposed in the left panel, showing a high degree of structural homology in the LSD1 catalytic domain for all three structures. LSD1 alone and LSD1:GSK also show high structural conservation in the alpha-helical tails; however, LSD1:phenelzine has a 5.4 Å displacement in this region. This region is important for CoREST binding, as shown in the middle panel (PDB 2UXX). Superposition of all structures in the left and middle panels is shown on the right, highlighting that CoREST binding is mediated by the correct position of these domains. All images were generated in Pymol. (C) The plot-profile feature of ImageJ was used to plot the fluorescence signal intensity along a single line spanning the nucleus (n = 5 lines per nucleus, 5 individual cells) using the average fluorescent signal intensity for the indicated pair of antibodies plotted for each point on the line with SE. (D) Pearson's correlation coefficient (PCC) indicating the colocalization of LSD1/CoREST and CoREST/SNAIL. *p < 0.05, **p< 0.005, ***p < 0.0005, ****p < 0.0001 Mann–Whitney t-test.
Figure 2
Figure 2
Phenelzine or M1 polarization upregulates M1 protein CD38 and targets the nuclear activity of LSD1. RAW264.7 cells were treated with LPS + IFN-γ, IL-4, or 500 μM phenelzine or GSK for 24 h. Protein targets (A) EGR2 and CD38 in F4/80+ cells were localized by confocal laser scanning microscopy. Single 0.5 μm optical sections were obtained using an Olympus-ASI automated microscope with 100x oil immersion lens running ASI software. The final image was obtained by employing a high-throughput automated stage with ASI spectral capture software. Digital images were analyzed using automated ASI software to determine the distribution and intensities automatically with automatic thresholding and background correction. Graphs represent either a dot plot of the individual cell intensities or the average TFI (n = 2,000 cells). (B) LSD1 activity assay on nuclear extracts of RAW264.7 cells either untreated, M1/M2 polarized, or treated with phenelzine, GSK, or LSD1 inhibitor tranylcypromine. (C) Images of RAW264.7 cells treated with vehicle control, LPS + IFN-γ (M1), and IL-4 (M2) for 24 h. Phenelzine and GSK treated cells did not show morphology changes in 24 h (data not shown). In comparison, cells were treated with Phenelzine or GSK for 7 days.
Figure 3
Figure 3
LSD1 can regulate genes associated with macrophage polarization toward an M1 phenotype and checkpoint molecules. RAW264.7 cells were untreated or treated with LPS + IFN-γ (M1), IL-4 (M2), or 500 μM of phenelzine or GSK for 24 h. Quantitative real-time PCR of genes associated with (A) M1-associated genes and (B) M2-associated genes were used to compare different treatment groups. Graphs are represented as mRNA levels normalized to GAPDH. Graphs show means ± SE (n = 3). *p < 0.05, **p < 0.005 Mann-Whitney t-test. (C) and (D) shows chromatin accessibility of genes in the promoter (C) and enchancer (D) regions of associated genes using quantitative real-time PCR using FAIRE samples. (E) 10nM LSD1 siRNA transfected cells and (F) checkpoint molecules and were used to compare different treatment groups.
Figure 4
Figure 4
Phenelzine treatment polarizes macrophages in the tumor microenvironment toward an M1 phenotype. (A) Treatment regime using the BALB/c 4T1 breast cancer model. (B) Tumor volumes of mice treated with vehicle control, Abraxane, Phenelzine or PD1 (n = 4/5). (C) Flow cytometry for total macrophages, inflammatory macrophages, and M2-like macrophages in the TME. *p < 0.05, Mann–Whitney t-test (n = 4/5). Representative images of (D) M1 and (E) M2 staining of FFPE tumor tissues in 4T1 mouse model. (F) Sections of primary 4T1 tumors were fixed and IF microscopy performed probing with M1 focused primary antibodies to F4/80, iNOS, CD86, and PDL1 with DAPI (green = F4/80 red = iNOS, yellow = CD86, cyan = PDL1, blue = DAPI). The population % of F4/80 cells positive for iNOS, CD86 and PDL1 was measured using ASI's mIF system. Representative images for each dataset are shown. Graphs plots represent the % population (n ≥ 500 cells profiled per a group, n = 4 mice). (G) Section of primary 4T1 tumors were fixed and IF microscopy performed probing with M2 focused primary antibodies to F4/80, EGR2, CD206, and PDL2 with DAPI (green = F4/80 red = EGR2, yellow = CD206, cyan = PDL2, blue = DAPI). The population % of F4/80 cells positive for EGR2, CD206, and PDL2 was measured using ASI's mIF system. Representative images for each dataset are shown. Graphs plots represent the % population (n ≥ 500 cells profiled per a group, n = 4 mice).
Figure 5
Figure 5
Nanostring counts (log2 fold-change) from RNA isolated from macrophages in the TME for (A) M1 phenotypic signatures and pathways, (B) M1 signaling molecules and transcription factors, (C) T cell activation gene signatures, and (D) CD169+ macrophage gene signatures. *Indicates Benjamini–Yekutieli false discovery rate value < 0.05.
Figure 6
Figure 6
CpG content, GC content, histone marks, and accessibility of genes in the NanoString panel. (A) CpG and GC content, (B,D) histone levels and (C) accessibility of genes ± 1 kb from transcription start site (TSS) of NanoString genes up-regulated, downregulated (FDR < 0.15), or unchanged (FDR > 0.15) and genes from refSeq in RAW264.7 cells (47). (C) shows accessibility of Nanostring genes against gene sets from bone marrow derived macrophages (BMDMs) with or without 6 h of LPS stimulation (48). (E) Levels of up/down regulated NanoString genes that had enhancers within 10 kb of their TSS from BMDMs with or without 24 h of LPS stimulation (31). A t-test with unequal variance (Welch two sample t-test) was used with *p < 0.05, **p < 0.01 and ***p < 0.001.
Figure 7
Figure 7
Phenelzine affects Hippo, Wnt, and Ras signaling pathways and genes associated with ECM remodeling and metabolism. (A) Heatmap displaying the undirected and directed global significance score statistics using the default and (B) KEGG pathway annotations. Undirected scores measure the extent of differential expression of a geneset's genes against control ignoring whether each gene within the set is up- or downregulated. Orange denotes genesets whose genes exhibit extensive differential expression against control, and blue denotes genesets with less differential expression. Directed scores measure the extent to which a geneset is up- or downregulated compared to control. Red denotes genesets that show extensive overexpression and blue denotes genesets with extensive underexpression. (C) Venn diagram indicating genes that are differentially expressed with a false discovery rate of < 0.05 (Benjamini-Yekutieli) and top 6 pathways that those genes are fall under. (D) Table showing the upregulated and downregulated genes that are specific to Abraxane and phenelzine.
Figure 8
Figure 8
Putative model of how LSD1 can reprogram macrophage polarization. (A) When macrophages are stimulated with LPS and IFN-γ (classical activation; M1), disruption of CoREST destabilizes LSD1, which leads to LSD1 losing its repressive role in regulating M1-associated genes. It also increases LSD1 demethylase activity. (B) When macrophages are stimulated with IL-4 (alternative activation; M2), CoREST is not affected, resulting in stable expression of LSD1p and LSD1 maintaining its repressive role in regulating M1-associated genes. It also decreases LSD1 demethylase activity. (C) LSD1 inhibition using phenelzine can target both LSD1p and CoREST, mimicking a similar response to M1 polarization while (D) GSK was not able to achieve the same result because it did not disrupt the LSD1/CoREST complex.

Similar articles

Cited by

References

    1. Torre LA, Siegel RL, Ward EM, Jemal A. Global cancer incidence and mortality rates and trends–an update. Cancer Epidemiol Biomarkers Prev. (2016) 25:16–27. 10.1158/1055-9965.EPI-15-0578 - DOI - PubMed
    1. Diana A, Franzese E, Centonze S, Carlino F, Della Corte CM, Ventriglia J, et al. . Triple-negative breast cancers: systematic review of the literature on molecular and clinical features with a focus on treatment with innovative drugs. Curr Oncol Rep. (2018) 20:76. 10.1007/s11912-018-0726-6 - DOI - PubMed
    1. Foulkes WD, Smith IE, Reis-Filho JS. Triple-negative breast cancer. N Engl J Med. (2010) 363:1938–48. 10.1056/NEJMra1001389 - DOI - PubMed
    1. Dent R, Trudeau M, Pritchard KI, Hanna WM, Kahn HK, Sawka CA, et al. . Triple-negative breast cancer: clinical features and patterns of recurrence. Clin Cancer Res. (2007) 13(15 Pt 1):4429–34. 10.1158/1078-0432.CCR-06-3045 - DOI - PubMed
    1. Sharma P. Biology and management of patients with triple-negative breast cancer. Oncologist. (2016) 21:1050–62. 10.1634/theoncologist.2016-0067 - DOI - PMC - PubMed

Publication types

MeSH terms