. 2019 Jun 12:10:561.
doi: 10.3389/fgene.2019.00561. eCollection 2019.

Genome-Wide Identification and Homoeologous Expression Analysis of PP2C Genes in Wheat (Triticum aestivum L.)

Affiliations

Genome-Wide Identification and Homoeologous Expression Analysis of PP2C Genes in Wheat (Triticum aestivum L.)

Xiaofen Yu et al. Front Genet. .

Abstract

Plant protein phosphatase 2Cs (PP2Cs) play crucial roles in phytohormone signaling, developmental processes, and both biotic and abiotic stress responses. However, little research has been conducted on the PP2C gene family in hexaploid wheat (Triticum aestivum L.), which is an important cereal crop. In this study, a genome-wide investigation of TaPP2C gene family was performed. A total of 257 homoeologs of 95 TaPP2C genes were identified, of which 80% of genes had all the three homoeologs across A, B, and D subgenomes. Domain analysis indicated that all the TaPP2C homoeologs harbored the type 2C phosphatase domains. Based on the phylogenetic analysis, TaPP2Cs were divided into 13 groups (A-M) and 4 single branches, which corresponded to the results of gene structure and protein motif analyses. Results of chromosomal location and synteny relationship analysis of TaPP2C homoeologs revealed that known chromosome translocation events and pericentromeric inversions were responsible for the formation of TaPP2C gene family. Expression patterns of TaPP2C homoeologs in various tissues and under diverse stress conditions were analyzed using publicly available RNA-seq data. The results suggested that TaPP2C genes regulate wheat developmental processes and stress responses. Homoeologous expression patterns of TaPP2C triad homoeologs from A, B, and D subgenomes, revealed expression bias within triads under the normal condition, and variability in expression under different stress treatments. Quantitative real-time PCR (qRT-PCR) analysis of eight TaPP2C genes in group A revealed that they were all up-regulated after abscisic acid treatment. Some genes in group A also responded to other phytohormones such as methyl jasmonate and gibberellin. Yeast two-hybrid assays showed that group A TaPP2Cs also interacted with TaSnRK2.1 and TaSnRK2.2 from subclass II, besides with subclass III TaSnRK2s. TaPP2C135 in group A was transformed into Arabidopsis and germination assay revealed that ectopic expression of TaPP2C135 in Arabidopsis enhanced its tolerance to ABA. Overall, these results enhance our understanding of the function of TaPP2Cs in wheat, and provide novel insights into the roles of group A TaPP2Cs. This information will be useful for in-depth functional analysis of TaPP2Cs in future studies and for wheat breeding.

Keywords: gene expression; genome-wide; homoeologous pattern; protein phosphatase 2C (PP2C); stress response; wheat.


Figures

FIGURE 1
FIGURE 1
Phylogenetic analysis of TaPP2C proteins. A total of 257 TaPP2C proteins were used to construct the phylogenetic tree using neighbor-joining method with ClustalX 2.1 and MEGA 6.0 with 1,000 bootstrap replicates. The PP2C proteins are divided into 13 distinct groups (A–M), which are indicated with different colors except for the ungrouped PP2C proteins.
FIGURE 2
FIGURE 2
Chromosomal distribution and duplication events of TaPP2C genes. All TaPP2C homoeologs were mapped to 21 wheat chromosomes (7 chromosomes of the A, B, and D subgenomes) using Circos. Chromosome number is indicated inside the outer circle. Different groups of TaPP2C genes are highlighted with different colored lines inside. Links in the central circle connect TaPP2C homoeolog triads. Bold orange links and bold purple links connect homoeologs involved in pericentromeric inversions and translocation events, respectively.
FIGURE 3
FIGURE 3
Gene structure, protein domain and motif analysis of TaPP2Cs. (A) Exon–intron structures of TaPP2C genes. (B) Distribution of conserved domains within TaPP2C proteins. (C) Distribution of all motifs identified by MEME.
FIGURE 4
FIGURE 4
Expression patterns of TaPP2C genes in various wheat tissues. Heatmap of TaPP2C RNA-seq data in five tissues at three different developmental stages was created by R program. Row clustering was applied. Grain_Z71, _Z75 and _Z85: grains at 2 days post anthesis (dpa), 15, and 30 dpa stages, respectively; Leaf_Z10, _Z23, and _Z71: seedling stage leaf and flag leaf at tillering, 2 dpa stages; Root_Z10, _Z13, and _Z39: roots at seedling, three leaf and flag leaf stage, respectively; Spike_Z32, _Z39, and _Z65: spikes at two-node, flag leaf and anthesis stages, respectively; Stem_Z30, _Z32, and _Z65: stems at 1 cm spike, two-node and anthesis stages, respectively. Red and blue cells indicate relative higher or lower expression.
FIGURE 5
FIGURE 5
Expression patterns of TaPP2C genes under different stresses. Heatmap of TaPP2C RNA-seq data under different stresses was created by R program. Expression profiles were clustered according to the groups of all TaPP2C homoeologs. (a) Expression profiles under heat and drought stresses. HD_6, HD_1: heat and drought treatments of 6, 1 h; H_6, H_1: heat treatment of 6, 1 h; D_6, D_1: heat treatment of 6, 1 h. CK stood for control check. (b) Expression profiles under cold stress. (c) Expression profiles under stripe rust (Puccinia striiformis f. sp. tritici; Pst) and powdery mildew (Blumeria graminis f. sp. tritici; Bgt) stresses. B3, B2, B1: infected with powdery mildew pathogen at 1, 2 and 3 days post infection (dpi), respectively; P3, P2, P1: infected with stripe rust pathogen at 1, 2, and 3 dpi, respectively. (d) Expression profiles under Pi starvation stress. S_Pi, S_CK: stems of 10 days Pi starvation and control check; R_Pi, R_CK: roots of 10 days Pi starvation and control check. The scale legend lies down the corresponding heatmap.
FIGURE 6
FIGURE 6
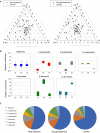
Homoeologous expression patterns of TaPP2C genes under stress conditions. (A) Ternary plot shows relative expression abundance of TaPP2C genes under heat and drought stresses compared with non-stress condition. Each circle represents a gene triad indicating the relative contribution of each homoeolog to the overall triad expression. (B) Seven categories of homoeologous expression patterns are illustrated as box plots. (C) Pie chart represents abundance of homoeologs from each subgenome on the basis of the seven categories.
FIGURE 7
FIGURE 7
Quantitative real-time PCR analysis of group A TaPP2C genes in response to ABA, NaCl, PEG, GA and MeJA treatments. Error bars represent the S.D. of three independent replicates. An asterisk indicates significant difference between the stress conditions and the control condition (P < 0.05, Tukey test).
FIGURE 8
FIGURE 8
Yeast two-hybrid analysis of group A TaPP2Cs and TaSnRK2s. Positive transformants were cultured on selective medium DDO (SD/-Leu/-Trp), TDO (SD/-Trp-Leu-Ade) and QDO (SD/-Trp-Leu-His-Ade) separately. Interaction between SV40-T and p53 was used as a positive control. Yeast strains were assessed at different dilution rates (1, 1/10, and 1/100).
FIGURE 9
FIGURE 9
Ectopic expression of TaPP2C135 in Arabidopsis. (A) Expression levels of TaPP2C135 in the transgenic lines and the wild type. (B) Seed germination of transgenic lines and the wild type on MS medium with or without ABA. (C) Statistical analysis of the germination greening ratio in (B). Error bars represent the S.D. of three independent replicates. The asterisks indicate significant differences compared with the wild type (∗∗∗P < 0.001, Tukey test).

References

    1. Akimoto-Tomiyama C., Tanabe S., Kajiwara H., Minami E., Ochiai H. (2018). Loss of chloroplast-localized protein phosphatase 2Cs in Arabidopsis thaliana leads to enhancement of plant immunity and resistance to Xanthomonas campestris pv. campestris infection. Mol. Plant Pathol. 19 1184–1195. 10.1111/mpp.12596 - DOI - PMC - PubMed
    1. Appels R., Eversole K., Feuillet C., Keller B., Rogers J., Stein N., et al. (2018). Shifting the limits in wheat research, and breeding using a fully annotated reference genome. Science 361:eaar7191. 10.112/science.aar7191 - DOI - PubMed
    1. Bailey T., Boden M., Buske F., Frith M., Grant C., Clementi L., et al. (2009). MEME SUITE: tools for motif discovery and searching. Nucleic Acids Res. 37 202–208. 10.1093/nar/gkp335 - DOI - PMC - PubMed
    1. Bhaskara G. B., Nguyen T. T., Verslues P. E. (2012). Unique drought resistance functions of the highly ABA-induced clade A protein phosphatase 2Cs. Plant Physiol. 160 379–395. 10.1104/pp.112.202408 - DOI - PMC - PubMed
    1. Brenchley R., Spannagl M., Pfeifer M., Barker G., D’Amore R., Allen A., et al. (2012). Analysis of the bread wheat genome using whole-genome shotgun sequencing. Nature 491 705–710. 10.1038/nature11650 - DOI - PMC - PubMed

LinkOut - more resources