Review
. 2019 Jun 12:6:117.
doi: 10.3389/fmed.2019.00117. eCollection 2019.

Hypoxia Imaging and Adaptive Radiotherapy: A State-of-the-Art Approach in the Management of Glioma

Affiliations
Review

Hypoxia Imaging and Adaptive Radiotherapy: A State-of-the-Art Approach in the Management of Glioma

Michael Gérard et al. Front Med (Lausanne). .

Abstract

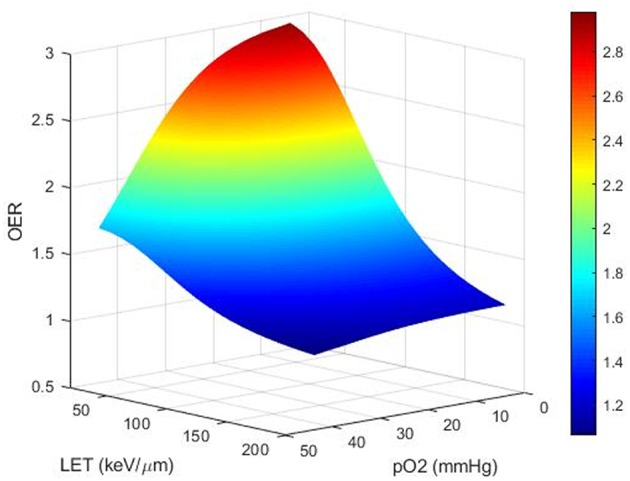
Severe hypoxia [oxygen partial pressure (pO2) below 5-10 mmHg] is more frequent in glioblastoma multiforme (GBM) compared to lower-grade gliomas. Seminal studies in the 1950s demonstrated that hypoxia was associated with increased resistance to low-linear energy transfer (LET) ionizing radiation. In experimental conditions, the total radiation dose has to be multiplied by a factor of 3 to achieve the same cell lethality in anoxic situations. The presence of hypoxia in human tumors is assumed to contribute to treatment failures after radiotherapy (RT) in cancer patients. Therefore, a logical way to overcome hypoxia-induced radioresistance would be to deliver substantially higher doses of RT in hypoxic volumes delineated on pre-treatment imaging as biological target volumes (BTVs). Such an approach faces various fundamental, technical, and clinical challenges. The present review addresses several technical points related to the delineation of hypoxic zones, which include: spatial accuracy, quantitative vs. relative threshold, variations of hypoxia levels during RT, and availability of hypoxia tracers. The feasibility of hypoxia imaging as an assessment tool for early tumor response to RT and for predicting long-term outcomes is discussed. Hypoxia imaging for RT dose painting is likewise examined. As for the radiation oncologist's point of view, hypoxia maps should be converted into dose-distribution objectives for RT planning. Taking into account the physics and the radiobiology of various irradiation beams, preliminary in silico studies are required to investigate the feasibility of dose escalation in terms of normal tissue tolerance before clinical trials are undertaken.

Keywords: MRI; PET; glioblastoma; hypoxia; imaging; radiation therapy.


Figures

Figure 1
Figure 1
Theoretical computational modeling of the OER as a function of pO2 and LET (performed on MATLAB). OER increases nonlinearly with increasing degree of hypoxia and decreases with increasing LET. Compared to low-LET conventional RT (photons or protons), high-LET RT, over a few hundreds of keV/μm (carbons), is expected to be less sensitive to hypoxia and could be more efficient for treating hypoxic tumors.
Figure 2
Figure 2
Chemical structure of the various PET tracers designed for hypoxia imaging.
Figure 3
Figure 3
The two main approaches of dose painting: by contour (DPBC) or by number (DPBN). For DPBC, added to the standard clinical dose level (in pink), the radiation oncologist manually delineates a uniform HTV (in black) corresponding to a subjective PET-uptake level threshold (dashed line). Note that both methods use PET images, but DPBN requires a mathematical data pre-processing step (*) that computes PET image into a “dose modulation map.” When performed, dose painting allows RT dosimetric simulation for optimal dose escalation.
Figure 4
Figure 4
Comparison of dose distribution and target coverage (GBM) in 3D-CRT (A), IMRT (B), and protontherapy (C). (B,C) show finer target coverage with increased normal tissue sparing. For clinical implementation of dose painting, these accurate RT techniques are needed (B,C). In current routine clinical practice, the target volume receives a homogeneous dose prescription and distribution regardless of potential hypoxic subvolumes.

References

    1. Simpson-Herren L, Lloyd HH. Kinetic parameters and growth curves for experimental tumor systems. Cancer Chemother. Rep. (1970) 54:143–74. - PubMed
    1. Norton L, Simon R, Brereton HD, Bogden AE. Predicting the course of Gompertzian growth. Nature. (1976) 264:542–5. 10.1038/264542a0 - DOI - PubMed
    1. Pouysségur J, Dayan F, Mazure NM. Hypoxia signalling in cancer and approaches to enforce tumour regression. Nature. (2006) 441:437–43. 10.1038/nature04871 - DOI - PubMed
    1. Leblond MM, Gérault AN, Corroyer-Dulmont A, MacKenzie ET, Petit E, Bernaudin M, et al. . Hypoxia induces macrophage polarization and re-education toward an M2 phenotype in U87 and U251 glioblastoma models. Oncoimmunology. (2016) 5:e1056442. 10.1080/2162402X.2015.1056442 - DOI - PMC - PubMed
    1. Corroyer-Dulmont A, Chakhoyan A, Collet S, Durand L, MacKenzie ET, Petit E, et al. . Imaging modalities to assess oxygen status in glioblastoma. Front Med. (2015) 2:57. 10.3389/fmed.2015.00057 - DOI - PMC - PubMed