

Global ecosystem overfishing: Clear delineation within real limits to production
- PMID: 31249861
- PMCID: PMC6594768
- DOI: 10.1126/sciadv.aav0474
Global ecosystem overfishing: Clear delineation within real limits to production
Abstract
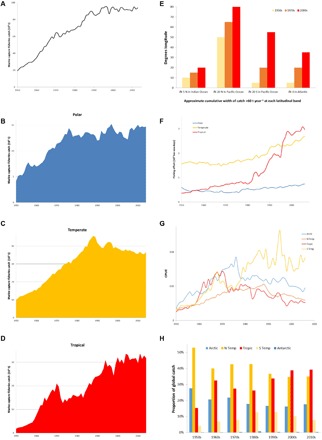
The well-documented value of marine fisheries is threatened by overfishing. Management typically focuses on target populations but lacks effective tools to document or restrain overexploitation of marine ecosystems. Here, we present three indices and accompanying thresholds to detect and delineate ecosystem overfishing (EOF): the Fogarty, Friedland, and Ryther indices. These are based on widely available and readily interpreted catch and satellite data that link fisheries landings to primary production using known limits of trophic transfer efficiency. We propose theoretically and empirically based thresholds for each of those indices; with these criteria, several ecosystems are fished sustainably, but nearly 40 to 50% of tropical and temperate ecosystems exceed even extreme thresholds. Applying these criteria to global fisheries data results in strong evidence for two specific instances of EOF, increases in both pressure on tropical fish and a climate-mediated polar shift. Here, we show that these two patterns represent evidence for global EOF.
Figures


References
-
- FAO, The State of World Fisheries and Aquaculture 2016, Contributing to Food Security and Nutrition For All (FAO, 2016).
-
- Blanchard J. L., Watson R. A., Fulton E. A., Cottrell R. S., Nash K. L., Bryndum-Buchholz A., Büchner M., Carozza D. A., Cheung W. W. L., Elliott J., Davidson L. N. K., Dulvy N. K., Dunne J. P., Eddy T. D., Galbraith E., Lotze H. K., Maury O., Müller C., Tittensor D. P., Jennings S., Linked sustainability challenges and trade-offs among fisheries, aquaculture and agriculture. Nat. Ecol. Evol. 1, 1240–1249 (2017). - PubMed
-
- Jennings S., Stentiford G. D., Leocadio A. M., Jeffery K. R., Metcalfe J. D., Katsiadaki I., Auchterlonie N. A., Mangi S. C., Pinnegar J. K., Ellis T., Peeler E. J., Luisetti T., Baker-Austin C., Brown M., Catchpole T. L., Clyne F. J., Dye S. R., Edmonds N. J., Hyder K., Lee J., Lees D. N., Morgan O. C., O’Brien C. M., Oidtmann B., Posen P. E., Santos A. R., Taylor N. G. H., Turner A. D., Townhill B. L., Verner-Jeffreys D. W., Aquatic food security: Insights into challenges and solutions from an analysis of interactions between fisheries, aquaculture, food safety, human health, fish and human welfare, economy and environment. Fish Fish. 17, 893–938 (2016).
-
- Hilborn R., Fulton E. A., Green B. S., Hartmann K., Tracey S. R., Watson R. A., When is a fishery sustainable? Can. J. Fish. Aquat. Sci. 72, 1433–1441 (2015).
-
- Link J. S., System-level optimal yield: increased value, less risk, improved stability, and better fisheries. Can. J. Fish. Aquat. Sci. 75, 1–16 (2018).
Publication types
MeSH terms
LinkOut - more resources
Full Text Sources
