. 2019 Jun 26;5(6):eaav0547.
doi: 10.1126/sciadv.aav0547. eCollection 2019 Jun.

De novo assembly of the goldfish (Carassius auratus) genome and the evolution of genes after whole-genome duplication

Affiliations

De novo assembly of the goldfish (Carassius auratus) genome and the evolution of genes after whole-genome duplication

Zelin Chen et al. Sci Adv. .

Abstract

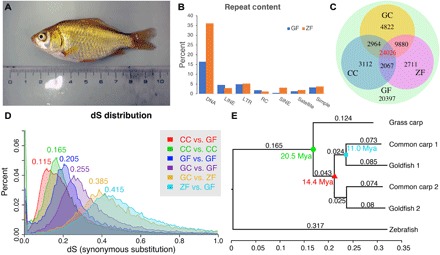
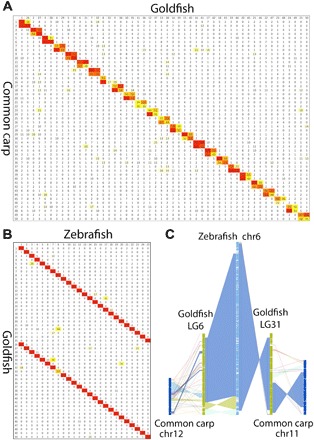
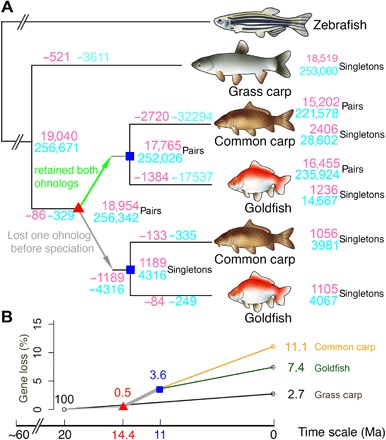
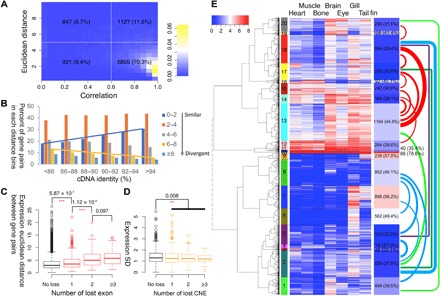
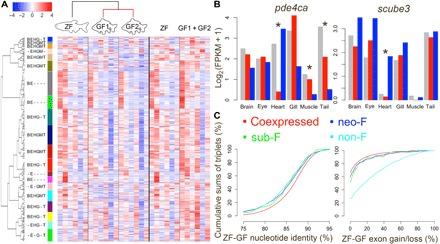
For over a thousand years, the common goldfish (Carassius auratus) was raised throughout Asia for food and as an ornamental pet. As a very close relative of the common carp (Cyprinus carpio), goldfish share the recent genome duplication that occurred approximately 14 million years ago in their common ancestor. The combination of centuries of breeding and a wide array of interesting body morphologies provides an exciting opportunity to link genotype to phenotype and to understand the dynamics of genome evolution and speciation. We generated a high-quality draft sequence and gene annotations of a "Wakin" goldfish using 71X PacBio long reads. The two subgenomes in goldfish retained extensive synteny and collinearity between goldfish and zebrafish. However, genes were lost quickly after the carp whole-genome duplication, and the expression of 30% of the retained duplicated gene diverged substantially across seven tissues sampled. Loss of sequence identity and/or exons determined the divergence of the expression levels across all tissues, while loss of conserved noncoding elements determined expression variance between different tissues. This assembly provides an important resource for comparative genomics and understanding the causes of goldfish variants.


Figures

Fig. 1
Fig. 1. Basic statistics for the goldfish genome in comparison to grass carp, common carp, and zebrafish.
(A) The gynogenetic goldfish used for sequencing before sacrifice. (B) Transposable elements distribution for goldfish (GF) and zebrafish (ZF). (C) Distribution of orthologous/ohnologous gene pairs by synonymous substitution among four species: zebrafish, grass carp (GC), common carp (CC), and goldfish. Numbers are a count of the homologous genes shared among zebrafish, common carp, and goldfish. (D) Rate of synonymous base changes (dS) for various species comparisons. (E) The phylogenetic tree shows the time of divergence of grass carp from goldfish and common carp (green circle), the WGD (red triangle), and divergence common carp and goldfish (cyan square). Each genome from the duplication was analyzed separately (chromosomes randomly assigned) and are denoted with _1 or _2 for both common carp and goldfish. (Photo credit: Yoshihiro Omori, Osaka University).
Fig. 2
Fig. 2. Chromosome collinearity is stable from zebrafish to goldfish.
(A) Reciprocal BLAST best gene pair counts for each pair of chromosomes between common carp and goldfish. Color from yellow to red indicates low to high counts, respectively. (B) Reciprocal BLAST best gene pair counts for each pair of chromosomes between goldfish and zebrafish. Color from yellow to red indicates low to high counts, respectively. Goldfish to common carp results in 50 bivalents, and goldfish to zebrafish shows a clear 1:2 relationship. (C) Chain alignment along zebrafish chromosome six and the two duplicated chromosomes from goldfish and common carp. Very large stretches of collinearity are readily visible between zebrafish and goldfish, as are simple intrachromosomal inversions. The more fragmented relationship with common carp (e.g., chr12) may be the result of a more fragmented common carp assembly.
Fig. 3
Fig. 3. The evolutionary relationships between zebrafish, grass carp, common carp, and goldfish can be used to study the dynamics of gene loss after WGD events.
(A) Using zebrafish as the reference, the tree tracks gene and CNE loss at different evolutionary branch points. Numbers on nodes or leaves indicate retained genes (pink) or CNEs (skyblue). Negative number on the branches indicates the number of lost genes (pink) or CNEs (skyblue) on the corresponding branch. The red triangle represents the carp WGD event at 14.4 Ma ago. The blue square marks the speciation of common carp and goldfish at 11.0 Ma ago. A maximum-likelihood phylogenetic tree was constructed by using the third position of all codons of ohnologous genes. (B) Decay curve of gene loss. The rates of gene loss accelerated after the genome duplication event (i.e., thick gray line between the red triangle and blue square). We assume that most cases where both copies of a gene were lost in either goldfish or carp occurred after separation from grass carp but before the WGD.
Fig. 4
Fig. 4. Gene expression is affected by changes in sequence, exon loss, and CNE loss.
(A) Histogram of expression correlation (x axis) and expression Euclidean distance (y axis) between WGD ohnolog gene pairs. Each box lists the number of ohnolog pairs (×2 for total genes) and the percentage of the total number of pairs this group represents. Most of the genes (70.3%) had a correlation of 0.6 or better. (B) Expression distance distribution in different cDNA identity groups. The more closely related the cDNA sequence, the more closely correlated gene expression was. (C) Boxplot of expression distance in gene groups with different numbers of lost exons. The more exons lost, the less related gene expression becomes. Asterisks mark statistically significant differences. (D) Boxplot of tissue expression SD in gene groups with different numbers of CNEs lost. Similar to exons, loss of CNEs correlates with loss of concordant expression, but the effect size is smaller. Asterisks denote significant differences. (E) Gene expression clustered into 20 groups for the 19,500 ohnologous genes. Heatmap and the keys indicate the value of log2(TPM + 1). Left color bar indicates different clusters. Right bars show the number and percentage of the gene pairs in the same cluster. Colored links indicate the number of gene pairs split between different clusters, only numbers larger than 100 were plotted, and thicker links indicate larger counts.
Fig. 5
Fig. 5. Systematic analysis of gene expression changes between duplicated genes can detect gene extinction, sub-F, and neo-F events.
(A) Genes clustered into 20 groups for the 8483 zebrafish-goldfish gene triplets. Heatmap and the keys indicate the normalized value (z score) of log2(FPKM + 1). The left color bar indicates different clusters, the text next to the cluster color bar indicates major zebrafish-expressed tissue in each cluster, and unlabeled ones are expressed in all zebrafish tissues. B, brain; E, eye; H, heart; G, gill; M, muscle; T, tail fin. (B) Example of expression of subfunctionalized (left) and neofunctionalized (right) genes. Gray bar, zebrafish; red and blue bar, two goldfish orthologs. Asterisks indicate tissue(s) associated with sub-F or neo-F. (C) Cumulative sum of triplets in different zebrafish-goldfish nucleotide identity groups (left) and exon gain/loss groups. Genes in non-F, neo-F, and sub-F triplets have low nucleotide identity and higher exon gain/loss than the coexpressed group. Genes in sub-F and neo-F triplets have medial exon gain/loss.

References

    1. Ota K. G., Abe G., Goldfish morphology as a model for evolutionary developmental biology. Wiley Interdiscip. Rev. Dev. Biol. 5, 272–295 (2016). - PMC - PubMed
    1. Chen S. C., Transparency and mottling, a case of Mendelian inheritance in the goldfish Carassius auratus. Genetics 13, 434–452 (1928). - PMC - PubMed
    1. Cerdá-Reverter J. M., Haitina T., Schiöth H. B., Peter R. E., Gene structure of the goldfish agouti-signaling protein: A putative role in the dorsal-ventral pigment pattern of fish. Endocrinology 146, 1597–1610 (2005). - PubMed
    1. Munkittrick K. R., Moccia R. D., Leatherland J. F., Polycystic kidney disease in goldfish (Carassius auratus) from Hamilton Harbour, Lake Ontario, Canada. Vet. Pathol. 22, 232–237 (1985). - PubMed
    1. Sahoo P. K., Swaminathan T. R., Abraham T. J., Kumar R., Pattanayak S., Mohapatra A., Rath S. S., Patra A., Adikesavalu H., Sood N., Pradhan P. K., Das B. K., Jayasankar P., Jena J. K., Detection of goldfish haematopoietic necrosis herpes virus (Cyprinid herpesvirus-2) with multi-drug resistant Aeromonas hydrophila infection in goldfish: First evidence of any viral disease outbreak in ornamental freshwater aquaculture farms in India. Acta Trop. 161, 8–17 (2016). - PubMed

Publication types