. 2019 Jun 26;5(6):eaav7769.
doi: 10.1126/sciadv.aav7769. eCollection 2019 Jun.

Nutrient availability shapes methionine metabolism in p16/ MTAP-deleted cells

Affiliations

Nutrient availability shapes methionine metabolism in p16/ MTAP-deleted cells

Sydney M Sanderson et al. Sci Adv. .

Abstract

Codeletions of gene loci containing tumor suppressors and neighboring metabolic enzymes present an attractive synthetic dependency in cancers. However, the impact that these genetic events have on metabolic processes, which are also dependent on nutrient availability and other environmental factors, is unknown. As a proof of concept, we considered panels of cancer cells with homozygous codeletions in CDKN2a and MTAP, genes respectively encoding the commonly-deleted tumor suppressor p16 and an enzyme involved in methionine metabolism. A comparative metabolomics analysis revealed that while a metabolic signature of MTAP deletion is apparent, it is not preserved upon restriction of nutrients related to methionine metabolism. Furthermore, re-expression of MTAP exerts heterogeneous consequences on metabolism across isogenic cell pairs. Together, this study demonstrates that numerous factors, particularly nutrition, can overwhelm the effects of metabolic gene deletions on metabolism. These findings may also have relevance to drug development efforts aiming to target methionine metabolism.


Figures
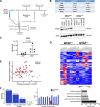
Fig. 1
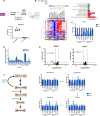
Fig. 1. Cancer cell lines exhibiting homozygous deletion of MTAP show altered patterns of metabolite levels.
(A) Methionine cycle. Methionine can be recycled from homocysteine via a donation from serine or glycine or salvaged by MTAP via conversion of the polyamine biosynthesis by-product MTA. SAM, s-adenosyl-methionine; SAH, s-adenosyl-homocysteine. (B) Cancer cell line panel of 10 lines from five different tissues, exhibiting either wild-type or homozygous deletion of p16/MTAP. Western blot validation of MTAP deletion. (C) Integrated intensity values (relative metabolite abundance) of MTA in MTAP+/+ versus MTAP−/− cell lines. P values were obtained from Student’s t test. (D) Heat map of top 50 differential metabolites between MTAP+/+ and MTAP−/− cell lines. Top affected pathways are indicated. (E) PCA of variance between MTAP+/+ and MTAP−/− groups. (F) Assignment of principal component (PC) that displays greatest variance between the indicated groups. AUC, area under the curve.
Fig. 2
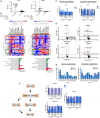
Fig. 2. Responsiveness to methionine availability is heterogeneous and is not predicted by MTAP status.
(A) Experimental setup and validation of methionine restriction. Each dot corresponds to the integrated intensity of detected methionine (averaged across three replicates) in each cell line for the indicated culture conditions. LC-MS, liquid chromatography–mass spectrometry. (B) Heat map of fold changes in global metabolite levels upon methionine restriction, hierarchically clustered by cell lines and metabolites. Top affected pathways are indicated. (C) Fold change values of MTA metabolite levels either in complete (100 μM Met, or Met+) or restricted (~3 μM Met, or Met). (D) Fraction of significantly altered (P < 0.05) metabolites that are related (i.e., within five reactions) or unrelated to methionine. (E) Volcano plot of fold change (Met/Met+) values of metabolites, averaged across either MTAP+/+ or MTAP−/− groups. P values obtained using Student’s t test. (F) Example of heterogeneous responsiveness to methionine restriction, as indicated by fold change in metabolites involved in the transsulfuration pathway.
Fig. 3
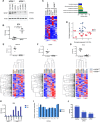
Fig. 3. Responsiveness to alterations in other one-carbon nutrient availability is largely MTAP status independent.
(A) Validation of serine and cysteine restriction. (B) Heat map of fold changes in global metabolite levels upon serine (left) and cysteine (right) restriction, hierarchically clustered by cell lines and metabolites. Top affected pathways are indicated. (C) Fold change values of MTA metabolite levels either in complete (280 μM Ser, or Ser+, and 200 μM Cys, or Cys+) or restricted (~16 μM Ser, or Ser, and 6 μM Cys, or Cys) medium. (D) Volcano plot of fold change (Ser/Ser+ or Cys/Cys+) values of metabolites, averaged across either MTAP+/+ or MTAP−/− groups. P values obtained using Student’s t test. GSSG, oxidized glutathione; CMP, cytidine 5′-monophosphate. (E) Fraction of significantly altered (P < 0.05, Student’s t test) metabolites that are related (i.e., within five reactions) or unrelated to serine (left) and cysteine (right). (F) Alterations in relative metabolite levels upon cysteine restriction in metabolites involved in taurine biosynthesis.
Fig. 4
Fig. 4. Restoration of MTAP expression produces heterogeneous effects on metabolism.
(A) Western blot validation of lentiviral ectopic expression of MTAP (compared to GFP control) in MTAP−/− cell lines. (B) Integrated intensity values of relative MTA metabolite levels in MTAP- or GFP-infected cell lines. (C) Volcano plots of each cell line, showing fold change values of metabolites between MTAP-infected and GFP-infected isogenic pairs. P values obtained using Student’s t test. IMP, inosine 5′-monophosphate; CDP, cytidine 5′-diphosphate. (D) Validation of nutrient restriction using integrated intensity values of the respective nutrient (left) and fold change values of MTA metabolite levels in complete/restricted culture conditions (right). (E) Number of significantly altered (P < 0.05, Student’s t test) metabolites in MTAP-expressing lines compared to GFP controls. (F) Fraction of significantly altered (P < 0.05, Student’s t test) metabolites that are related (i.e., within five reactions) or unrelated to the indicated nutrient.
Fig. 5
Fig. 5. MTAP status remains nonpredictive of responsiveness to nutrient restriction in a panel of tissue-matched cell lines.
(A) Western blot validation of MTAP expression. (B) Relative metabolite abundance of MTA in MTAP+/+ versus MTAP−/− cell lines. P values were obtained from Student’s t test. (C) Heat map of top 50 differential metabolites between MTAP+/+ and MTAP−/− cell lines. Top affected pathways are indicated. (D) PCA of variance between MTAP+/+ and MTAP−/− groups. (E to G) Relative metabolite abundance of (E) methionine, (F) cysteine, and (G) serine and the resulting heat maps of global metabolic profiles generated in each cell line from the indicated nutrient restriction. (H) Relative metabolite abundance of MTA in cell lines cultured in complete or methionine-restricted medium. (I) Fraction of significantly altered (P < 0.05, Student’s t test) metabolites that are related (i.e., within five reactions) or unrelated to methionine. (J) Assignment of PC that displays greatest variance between the indicated groups.
Fig. 6
Fig. 6. Integration of responsiveness to nutrient restriction determines quantitative impact of MTAP deletion on global metabolic networks.
(A) Number of significantly altered (P < 0.05, Student’s t test) metabolites for each cell line under each of the three nutrient restriction conditions. (B) Venn diagrams depicting overlap of average number of significantly altered related metabolites within a cell line for MTAP+/+ and MTAP−/− groups. (C) Number of significantly altered metabolites for each nutrient restriction, as determined by three separate statistical analyses as indicated. (D) Number of total unique significantly altered metabolites for each condition indicated. (E) AUC of top PCs that account for 70% of variance between either MTAP+/+ and MTAP−/− or control and restricted nutrient conditions. (F) Graphical summary illustrating that environment and cell identity shape the metabolome to a greater extent than MTAP status or tissue of origin.

References

    1. Beroukhim R., Mermel C. H., Porter D., Wei G., Raychaudhuri S., Donovan J., Barretina J., Boehm J. S., Dobson J., Urashima M., Mc Henry K. T., Pinchback R. M., Ligon A. H., Cho Y.-J., Haery L., Greulich H., Reich M., Winckler W., Lawrence M. S., Weir B. A., Tanaka K. E., Chiang D. Y., Bass A. J., Loo A., Hoffman C., Prensner J., Liefeld T., Gao Q., Yecies D., Signoretti S., Maher E., Kaye F. J., Sasaki H., Tepper J. E., Fletcher J. A., Tabernero J., Baselga J., Tsao M.-S., Demichelis F., Rubin M. A., Janne P. A., Daly M. J., Nucera C., Levine R. L., Ebert B. L., Gabriel S., Rustgi A. K., Antonescu C. R., Ladanyi M., Letai A., Garraway L. A., Loda M., Beer D. G., True L. D., Okamoto A., Pomeroy S. L., Singer S., Golub T. R., Lander E. S., Getz G., Sellers W. R., Meyerson M., The landscape of somatic copy-number alteration across human cancers. Nature 463, 899–905 (2010). - PMC - PubMed
    1. Zhang H., Chen Z.-H., Savarese T. M., Codeletion of the genes for p16INK4, methylthioadenosine phosphorylase, interferon-α1, interferon-β1, and other 9p21 markers in human malignant cell lines. Cancer Genet. Cytogenet. 86, 22–28 (1996). - PubMed
    1. Lubin M., Lubin A., Selective killing of tumors deficient in methylthioadenosine phosphorylase: A novel strategy. PLOS ONE 4, e5735 (2009). - PMC - PubMed
    1. Tang B., Kadariya Y., Chen Y., Slifker M., Kruger W. D., Expression of MTAP inhibits tumor-related phenotypes in HT1080 cells via a mechanism unrelated to its enzymatic function. G3 5, 35–44 (2014). - PMC - PubMed
    1. de Oliveira S. F. V., Ganzinelli M., Chilà R., Serino L., Maciel M. E., de Andrade Urban C., de Lima R. S., Cavalli I. J., Generali D., Broggini M., Damia G., de Souza Fonseca Ribeiro E. M., Characterization of MTAP gene expression in breast cancer patients and cell lines. PLOS ONE 11, e0145647 (2016). - PMC - PubMed

Publication types

MeSH terms

Substances