. 2019 Jun 18;5(6):e01902.
doi: 10.1016/j.heliyon.2019.e01902. eCollection 2019 Jun.

UVC photon-induced denaturing of DNA: A possible dissipative route to Archean enzyme-less replication

Affiliations

UVC photon-induced denaturing of DNA: A possible dissipative route to Archean enzyme-less replication

Karo Michaelian et al. Heliyon. .

Abstract

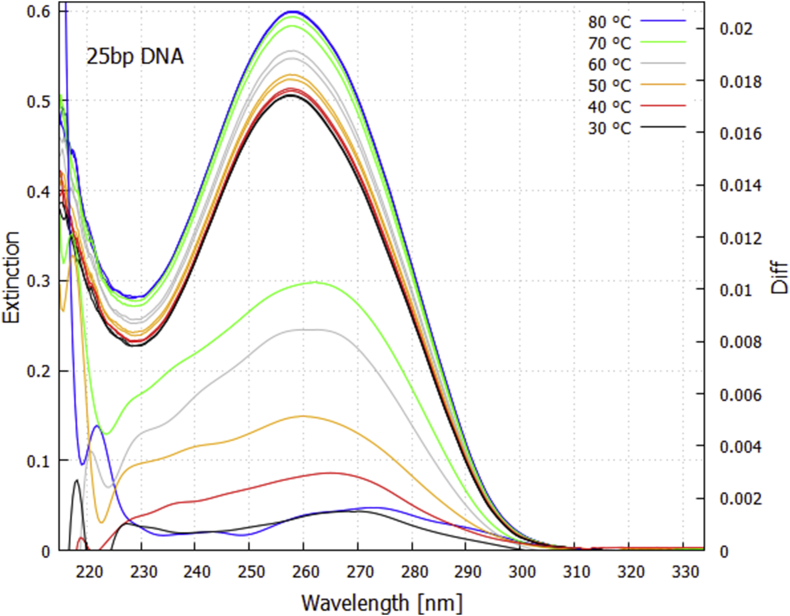
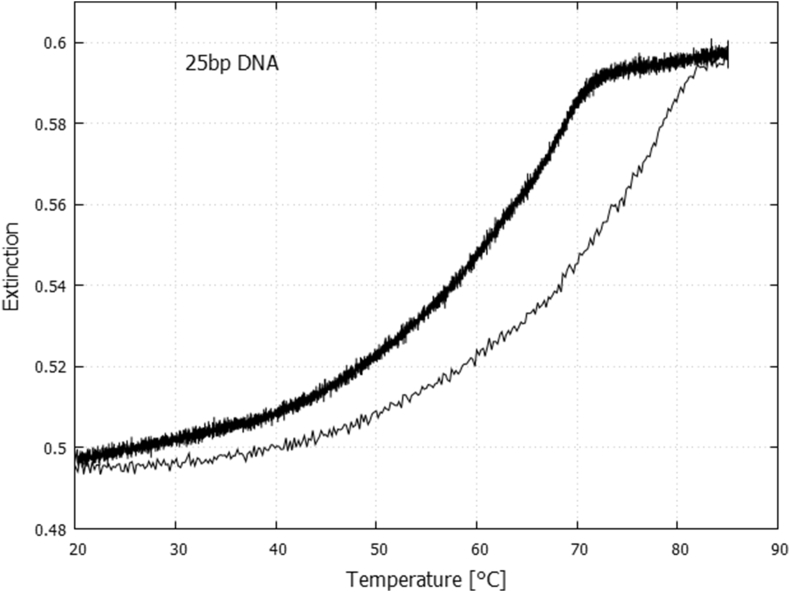
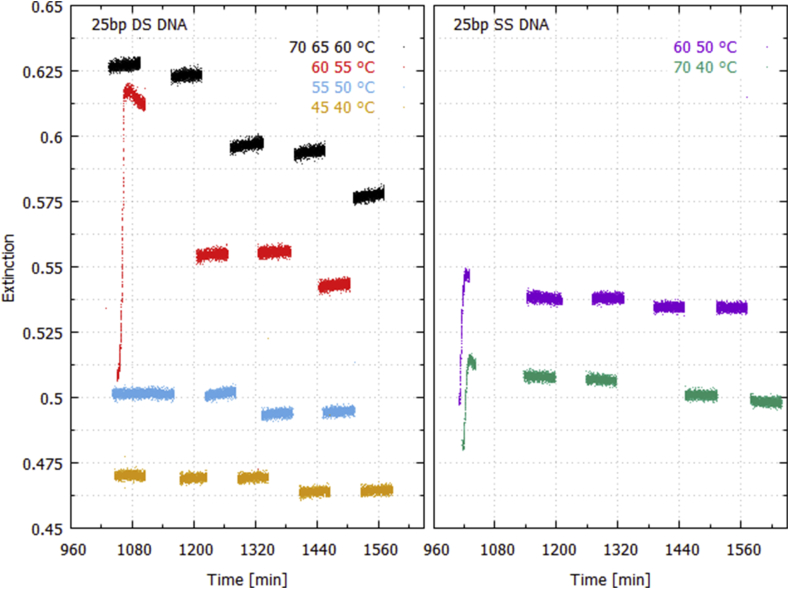
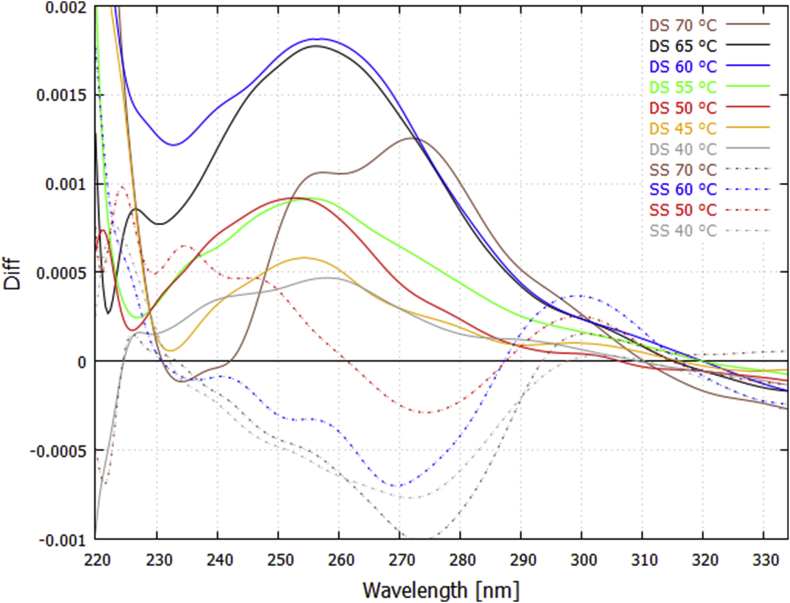
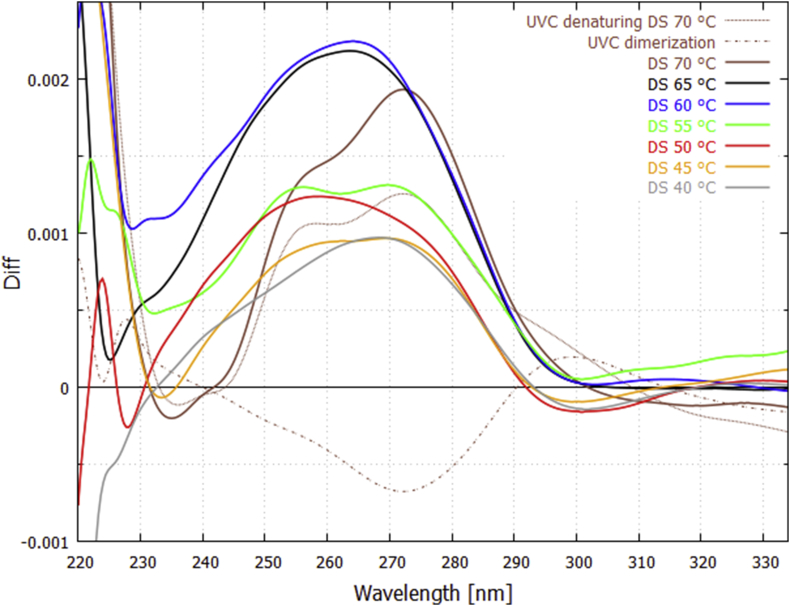
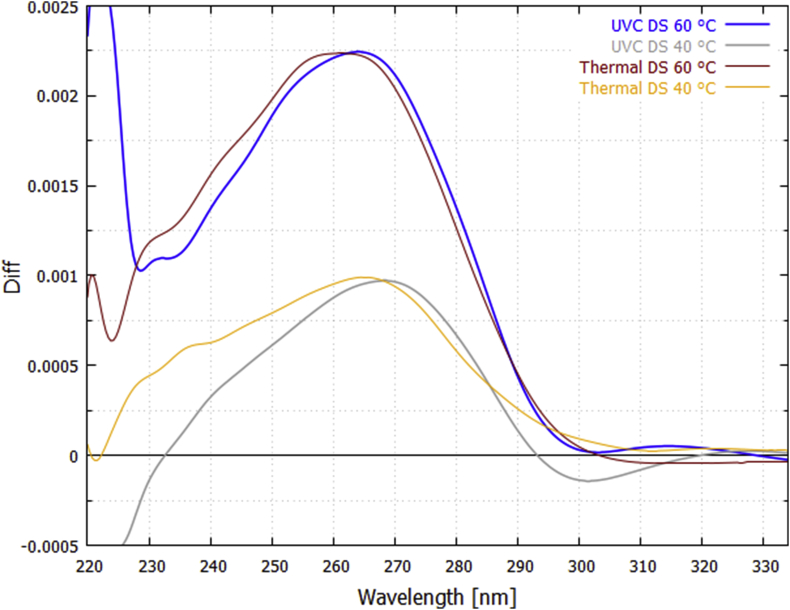
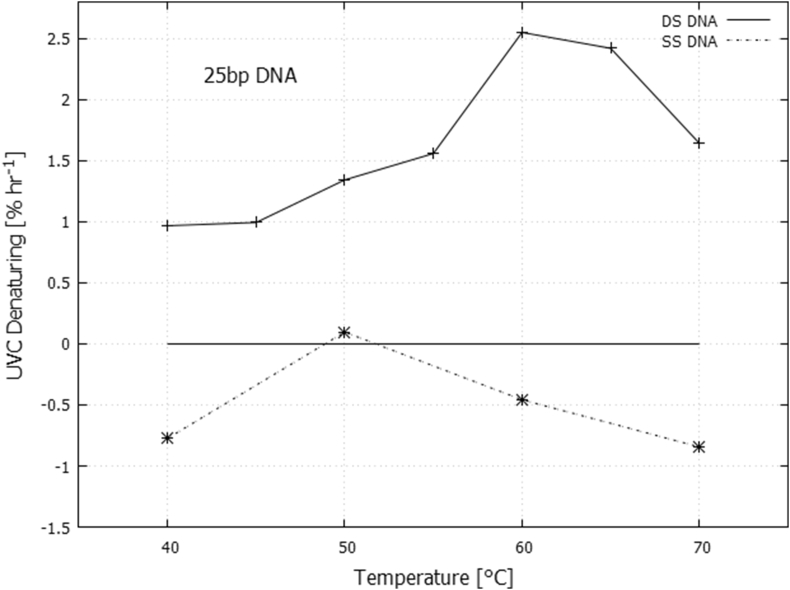
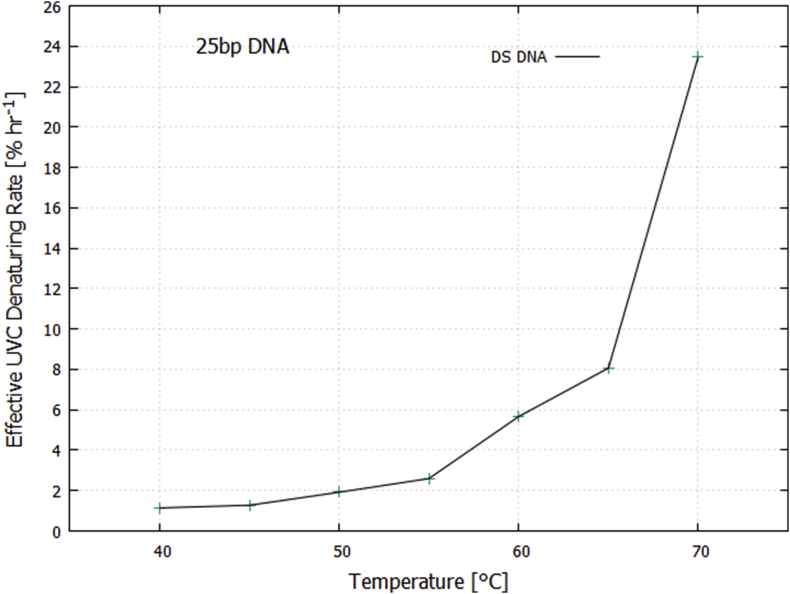
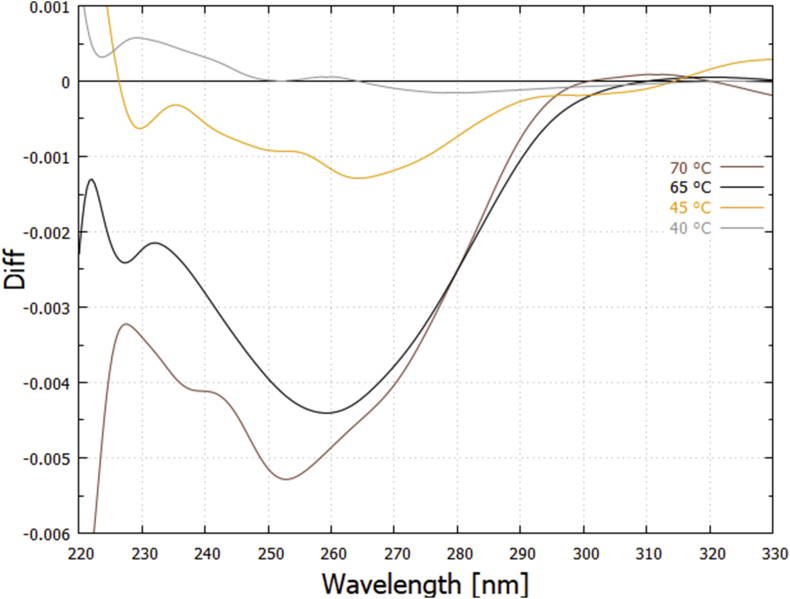
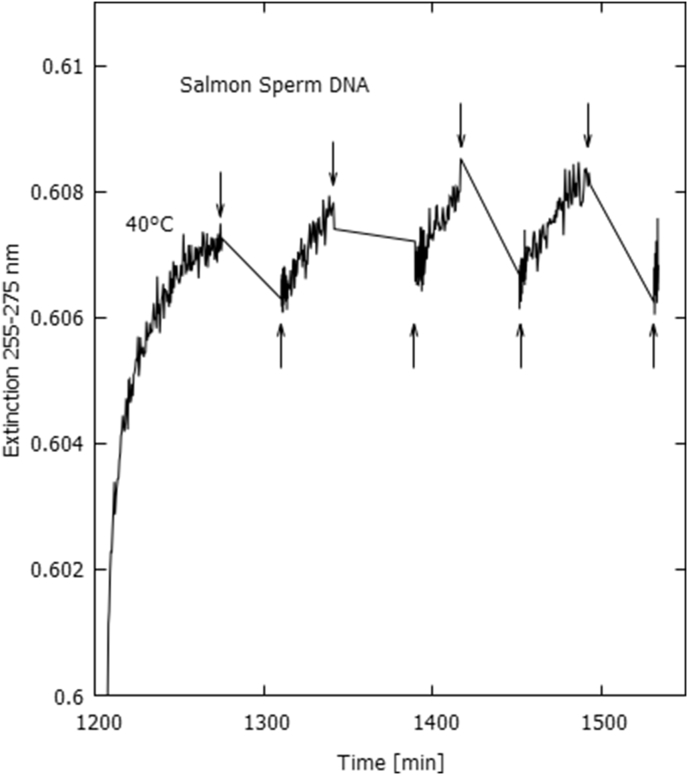
Non-equilibrium thermodynamics is a relevant framework from within which to address formidable difficulties encountered in explaining the origin of life; from molecular synthesis and complexation, enzyme-less proliferation, to evolution (including the acquisition of homochirality and information). From within this framework we have proposed that the origin of life was the origin of the dissipative structuring of organic pigments which became the fundamental molecules of life (e.g. RNA and DNA) proliferated through autocatalytic photochemical reactions under the thermodynamic imperative of dissipating the imposed UVC solar photon flux available at the Archean surface. Here we present experimental evidence demonstrating that the absorption and dissipation of UVC light by synthetic DNA of 25 base pairs (and also natural salmon sperm DNA) over a range of temperatures, including below their melting temperature, leads to denaturing. Since denaturing is a non-trivial step on route to enzyme-less replication, our data suggest the possibility of a dissipative route to DNA replication at the origin of life. Such a dissipation-replication relation provides a simple mechanism for the early accumulation of both homochirality and information. Possible mechanisms of UVC photon-induced denaturing of DNA are discussed.

Keywords: Biochemistry; DNA; DNA denaturing; Dissipation; Enzyme-less replication; Homochirality; Irreversible thermodynamics; Molecular biology; Origin of life; RNA.


Figures

Fig. 1
Fig. 1
Extinction as a function of wavelength and temperature for the 25 bp DNA in PBS buffer and the corresponding thermal difference spectra (lower curves, right y-axis) obtained by subtracting the lower temperature extinction curve from the higher temperature curve for a 3 °C bin centered at the specified temperature. The difference spectra have been smoothed with a 2000 point Bezier function.
Fig. 2
Fig. 2
The denaturing curve for the 25 bp synthetic DNA in PBS buffer obtained by averaging the extinction over wavelengths 255–262 nm (centered on the peak at 258 nm, Fig. 1). The melting temperature, as determined by the half-way point of the hyperchromic rise is 59.4 °C, and by the inflexion in the slope is 69.1 °C. The well known hysteresis is observed between the curve for a rapid increase in temperature (5 °C/min – thin line) to 85 °C and that for a slow decrease in temperature (0.3 °C/min – thick line) to 20 °C.
Fig. 3
Fig. 3
Extinction averaged over wavelengths 250–266 nm as a function of time (minutes since midnight) for double strand (left) and single strand (right) 25 bp DNA while cycling the deuterium light on and off through the sample for periods of one hour. There are at least 2 repetitions at each temperature. Traces of a given color represent a run of a particular day normalized to the particular dark spectrum for that run and compared to a reference spectrum common to all runs. An increase in extinction is observed during the light-on periods for double strand DNA, but not for single strand.
Fig. 4
Fig. 4
Difference spectra obtained for UVC light-induced denaturing at 70, 65, 60, 55, 50, 45, and 40 °C for double strand (DS – upper solid curves) 25 bp DNA, and at 70, 60, 50, and 40 °C for single strand (SS - lower dashed curves). The average of the two light-on runs at a given temperature (see Fig. 3) is plotted and the data have been smoothed with a 2000 point Bezier function. An increase in extinction over the light-on period is observed for the double strand DNA (attributed to light-induced denaturing), while a decrease at ~273 nm is observed for single strand DNA (attributed to dimer formation). For the double strand DNA at 70 °C, light-induced denaturing appears to be operating predominantly over G-C bonds, as suggested by the two peaks in the curve at 254 nm and 272 nm, which correspond to the maximum absorption of guanine and cytosine respectively.
Fig. 5
Fig. 5
UVC light-induced denaturing curves corrected for dimer formation. An example is given for 70 °C (plum colored lines), the inverse of the lower dotted curve (reduction in extinction due to dimer formation obtained by averaging over the four dashed lines in Fig. 4) is added to the upper solid curve (increase in extinction due to UVC denaturing) to give the corrected denaturing thick plum colored line. Only the final result is given for the other temperatures but the constituent curves appear in Fig. 4.
Fig. 6
Fig. 6
Comparison of the wavelength dependence of UVC photon-induced denaturing (Fig. 5) with thermal-induced denaturing (Fig. 1) for the 25 bp synthetic DNA at 60 and 40 °C. The thermal-induced difference curves correspond to a 3 °C bin centered on the particular temperature and they have been normalized by multiplying by factors 0.265 and 0.335 for 60 and 40 °C respectively. The data have been smoothed with a 2000 point Bezier function.
Fig. 7
Fig. 7
Rate of UVC light-induced denaturing as a function of temperature for double strand 25 bp DNA (+) and rate of reduction in absorption due to dimer formation for single strand 25 bp DNA (*). Values plotted are integrals from 235 to 295 nm of the difference curves given in Fig. 5 normalized to that obtained for complete thermal denaturing.
Fig. 8
Fig. 8
Effective rate of UVC light-induced denaturing of still bonded base pairs for the double strand 25 bp DNA as a function of temperature.
Fig. 9
Fig. 9
Renaturing difference curves obtained over the light-off periods for selected fixed temperatures. As expected, the wavelength dependence of the renaturing curves is similar to the inverse of that for the thermal denaturing curves (Fig. 1, lower curves). At 70 °C, renaturing appears to be operating predominantly over G-C bonds, as suggested by the two peaks in the curve at 254 nm and 272 nm (corresponding to the maximum absorption of guanine and cytosine respectively). This was also observed for UVC light-induced denaturing at 70 °C (Fig. 4). The data have been smoothed by a Bezier 2000 point function.
Fig. 10
Fig. 10
An increase in extinction (averaged over 255–275 nm) is observed and is attributed to UVC light-induced denaturing beginning at the ½ hour light-on periods (up arrows), and a decrease in extinction attributed to renaturing beginning at the ½ hour light-off periods (down arrows), for Salmon sperm DNA in purified water at 40 °C. The low intensity deuterium light was used to obtain these results.

Similar articles

Cited by

References

    1. Michaelian K. Thermodynamics stability of ecosystems. J. Theor. Biol. 2005;237:323–335. - PubMed
    1. Michaelian K. 2009. Thermodynamic Origin of Life. arXiv:0907.0042 [physics-gen-ph]. Preprint at https://arxiv.org/abs/0907.0042.
    1. Michaelian K. Thermodynamic dissipation theory for the origin of life. Earth Sys. Dynam. 2011;2:37–51.
    1. Michaelian K. Entropy production and the origin of life. J. Mod. Phys. 2011;2(26):595–601.
    1. Michaelian K. A non-linear irreversible thermodynamic perspective on organic pigment proliferation and biological evolution. J. Phys. Conf. Ser. 2013;475

LinkOut - more resources