Randomized Controlled Trial
. 2019 Oct 1;110(4):862-872.
doi: 10.1093/ajcn/nqz120.

Branched-chain amino acid and branched-chain ketoacid ingestion increases muscle protein synthesis rates in vivo in older adults: a double-blind, randomized trial

Affiliations
Randomized Controlled Trial

Branched-chain amino acid and branched-chain ketoacid ingestion increases muscle protein synthesis rates in vivo in older adults: a double-blind, randomized trial

Cas J Fuchs et al. Am J Clin Nutr. .

Abstract

Background: Protein ingestion increases muscle protein synthesis rates. However, limited data are currently available on the effects of branched-chain amino acid (BCAA) and branched-chain ketoacid (BCKA) ingestion on postprandial muscle protein synthesis rates.

Objective: The aim of this study was to compare the impact of ingesting 6 g BCAA, 6 g BCKA, and 30 g milk protein (MILK) on the postprandial rise in circulating amino acid concentrations and subsequent myofibrillar protein synthesis rates in older males.

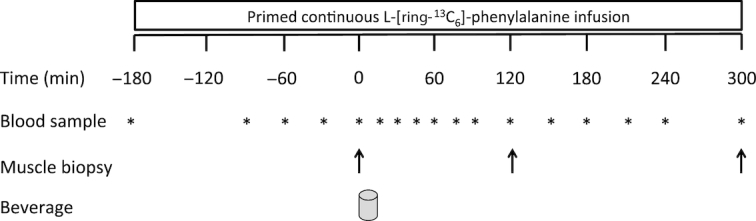
Methods: In a parallel design, 45 older males (age: 71 ± 1 y; BMI: 25.4 ± 0.8 kg/m2) were randomly assigned to ingest a drink containing 6 g BCAA, 6 g BCKA, or 30 g MILK. Basal and postprandial myofibrillar protein synthesis rates were assessed by primed continuous l-[ring-13C6]phenylalanine infusions with the collection of blood samples and muscle biopsies.

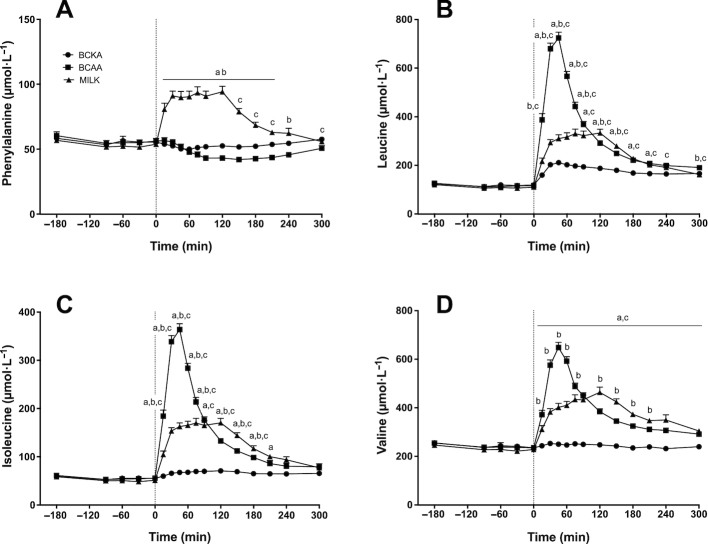
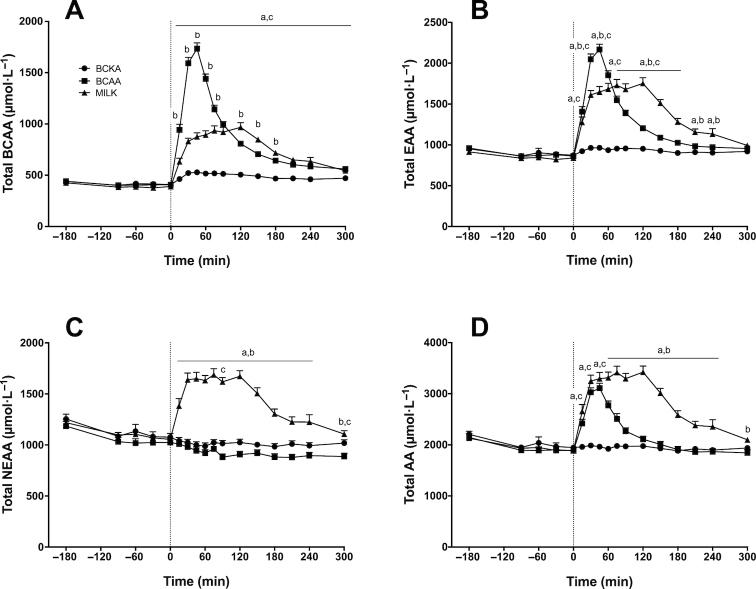
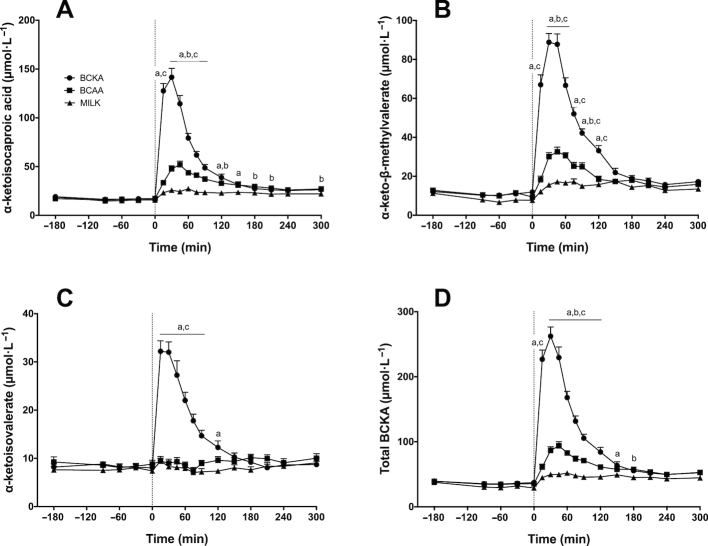
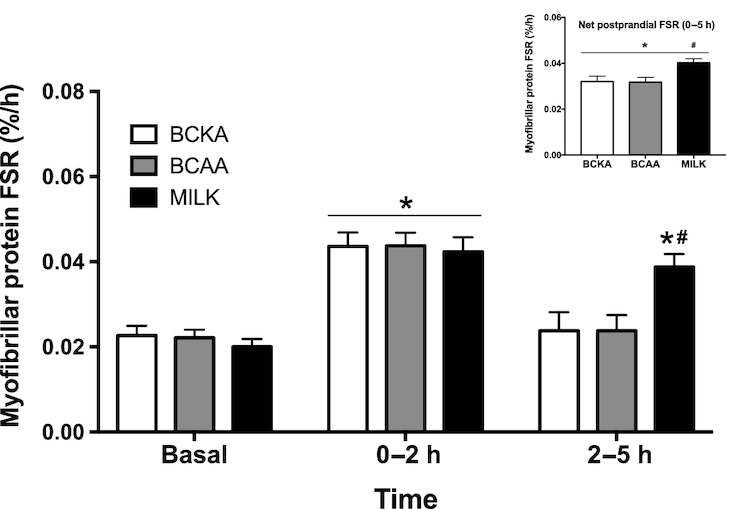
Results: Plasma BCAA concentrations increased following test drink ingestion in all groups, with greater increases in the BCAA and MILK groups compared with the BCKA group (P < 0.05). Plasma BCKA concentrations increased following test drink ingestion in all groups, with greater increases in the BCKA group compared with the BCAA and MILK groups (P < 0.05). Ingestion of MILK, BCAA, and BCKA significantly increased early myofibrillar protein synthesis rates (0-2 h) above basal rates (from 0.020 ± 0.002%/h to 0.042 ± 0.004%/h, 0.022 ± 0.002%/h to 0.044 ± 0.004%/h, and 0.023 ± 0.003%/h to 0.044 ± 0.004%/h, respectively; P < 0.001), with no differences between groups (P > 0.05). Myofibrillar protein synthesis rates during the late postprandial phase (2-5 h) remained elevated in the MILK group (0.039 ± 0.004%/h; P < 0.001), but returned to baseline values following BCAA and BCKA ingestion (0.024 ± 0.005%/h and 0.024 ± 0.005%/h, respectively; P > 0.05).

Conclusions: Ingestion of 6 g BCAA, 6 g BCKA, and 30 g MILK increases myofibrillar protein synthesis rates during the early postprandial phase (0-2 h) in vivo in healthy older males. The postprandial increase following the ingestion of 6 g BCAA and BCKA is short-lived, with higher myofibrillar protein synthesis rates only being maintained following the ingestion of an equivalent amount of intact milk protein. This trial was registered at Nederlands Trial Register (www.trialregister.nl) as NTR6047.

Keywords: aging; anabolism; chronic kidney disease; dietary protein; leucine; milk; sarcopenia; α-ketoisocaproic acid.


Figures

FIGURE 1
FIGURE 1
Schematic overview of the infusion protocol. Participants consumed either 30 g MILK, 6 g BCAAs, or 6 g BCKAs.
FIGURE 2
FIGURE 2
Plasma glucose concentrations over time after the ingestion of 30 g milk protein (MILK; n = 15), 6 g branched-chain amino acids (BCAA; n = 15), or 6 g branched-chain ketoacids (BCKA; n = 15) in healthy older males. The dotted line represents the ingestion of the drink. Values represent means + SEM. Data were analyzed with repeated measures (time × treatment group) ANOVA and separate analyses were performed when a significant interaction was detected. Bonferroni post hoc testing was used to detect differences between groups. Time × treatment interaction, P < 0.001. b, MILK significantly different (P < 0.05) from BCAA.
FIGURE 3
FIGURE 3
Plasma insulin concentrations over time (A) and total insulin responses, expressed as incremental AUC (B) after the ingestion of 30 g milk protein (MILK; n = 15), 6 g branched-chain amino acids (BCAA; n = 15), or 6 g branched-chain ketoacids (BCKA; n = 15) in healthy older males. The dotted line represents the ingestion of the drink. Values represent means + SEM. Data in panel A were analyzed using repeated measures (time × treatment group) ANOVA and separate analyses were performed when a significant interaction was detected. Bonferroni post hoc testing was used to detect differences between groups. Time × treatment interaction, P < 0.001. a, MILK significantly different (P < 0.05) from BCKA; b, MILK significantly different (P < 0.05) from BCAA. Data in panel B were analyzed using a one-factor ANOVA with Bonferroni correction. #Significantly different (P < 0.05) from BCAA and BCKA.
FIGURE 4
FIGURE 4
Plasma total ammonia concentrations, expressed as incremental AUC after the ingestion of 30 g milk protein (MILK; n = 15), 6 g branched-chain amino acids (BCAA; n = 15), or 6 g branched-chain ketoacids (BCKA; n = 15) in healthy older males. Values represent means ± SEM. Data were analyzed using a one-factor ANOVA. No significant differences between treatments (P > 0.05).
FIGURE 5
FIGURE 5
Plasma phenylalanine (A), leucine (B), isoleucine (C), and valine (D) concentrations over time after the ingestion of 30 g milk protein (MILK; n = 15), 6 g branched-chain amino acids (BCAA; n = 15), or 6 g branched-chain ketoacids (BCKA; n = 15) in healthy older males. The dotted line represents the ingestion of the drink. Values represent means + SEM. Data were analyzed with repeated measures (time × treatment group) ANOVA and separate analyses were performed when a significant interaction was detected. Bonferroni post hoc testing was used to detect differences between groups. Time × treatment interaction, P < 0.001. a, MILK significantly different (P < 0.05) from BCKA; b, MILK significantly different (P < 0.05) from BCAA; c, BCAA significantly different (P < 0.05) from BCKA.
FIGURE 6
FIGURE 6
Plasma branched-chain amino acids (BCAA; A), essential amino acid (EAA; B), nonessential amino acid (NEAA-glutamine; C), and total amino acid (TAA-glutamine; D) concentrations over time after the ingestion of 30 g milk protein (MILK; n = 15), 6 g BCAA (n = 15), or 6 g branched-chain ketoacids (BCKA; n = 15) in healthy older males. The dotted line represents the ingestion of the drink. Values represent means + SEM. Data were analyzed with repeated measures (time × treatment group) ANOVA and separate analyses were performed when a significant interaction was detected. Bonferroni post hoc testing was used to detect differences between groups. Time × treatment interaction, P < 0.001. a, MILK significantly different (P < 0.05) from BCKA; b, MILK significantly different (P < 0.05) from BCAA; c, BCAA significantly different (P < 0.05) from BCKA.
FIGURE 7
FIGURE 7
Plasma α-ketoisocaproic acid (KIC; the α-ketoacid of leucine; A), α-keto-β-methylvalerate (KMV; the α-ketoacid of isoleucine; B), α-ketoisovalerate (KIV; the α-ketoacid of valine; C), and branched-chain ketoacid (BCKA) (D) concentrations over time after the ingestion of 30 g milk protein (MILK; n = 15), 6 g branched-chain amino acids (BCAA; n = 15), or 6 g BCKA (n = 15) in healthy older males. The dotted line represents the ingestion of the drink. Values represent means + SEM. Data were analyzed with repeated measures (time × treatment group) ANOVA and separate analyses were performed when a significant interaction was detected. Bonferroni post hoc testing was used to detect differences between groups. Time × treatment interaction, P < 0.001. a, MILK significantly different (P < 0.05) from BCKA; b, MILK significantly different (P < 0.05) from BCAA; c, BCAA significantly different (P < 0.05) from BCKA.
FIGURE 8
FIGURE 8
Myofibrillar protein fractional synthetic rates (FSR; in %/h) during the fasting state (basal) and over the early (0–2 h), late (2–5 h), and entire (0–5 h) postprandial period after the ingestion of 30 g milk protein (MILK; n = 15), 6 g branched-chain amino acids (BCAA; n = 15), or 6 g branched-chain ketoacids (BCKA; n = 15) in healthy older males. Values represent means + SEM. Data were analyzed with repeated measures (time × treatment group) ANOVA and separate analyses were performed when a significant interaction was detected. Bonferroni post hoc testing was used to detect differences between groups. *Significantly different (P < 0.01) from basal; #significantly different (P < 0.05) from BCAA and BCKA.

Comment in

References

    1. Rennie MJ, Bohe J, Wolfe RR. Latency, duration and dose response relationships of amino acid effects on human muscle protein synthesis. J Nutr. 2002;132:3225S–7S. - PubMed
    1. Wolfe RR. Regulation of muscle protein by amino acids. J Nutr. 2002;132:3219S–24S. - PubMed
    1. Bennet WM, Connacher AA, Scrimgeour CM, Smith K, Rennie MJ. Increase in anterior tibialis muscle protein synthesis in healthy man during mixed amino acid infusion: Studies of incorporation of [1-13C]leucine. Clin Sci (Lond). 1989;76:447–54. - PubMed
    1. Bohe J, Low A, Wolfe RR, Rennie MJ. Human muscle protein synthesis is modulated by extracellular, not intramuscular amino acid availability: A dose-response study. J Physiol. 2003;552:315–24. - PMC - PubMed
    1. Atherton PJ, Smith K, Etheridge T, Rankin D, Rennie MJ. Distinct anabolic signalling responses to amino acids in C2C12 skeletal muscle cells. Amino Acids. 2010;38:1533–9. - PubMed

Publication types

Associated data