. 2020 Jan;20(1):75-87.
doi: 10.1111/ajt.15517. Epub 2019 Jul 24.

Circulating T follicular helper cells are a biomarker of humoral alloreactivity and predict donor-specific antibody formation after transplantation

Affiliations

Circulating T follicular helper cells are a biomarker of humoral alloreactivity and predict donor-specific antibody formation after transplantation

Glenn Michael La Muraglia 2nd et al. Am J Transplant. 2020 Jan.

Abstract

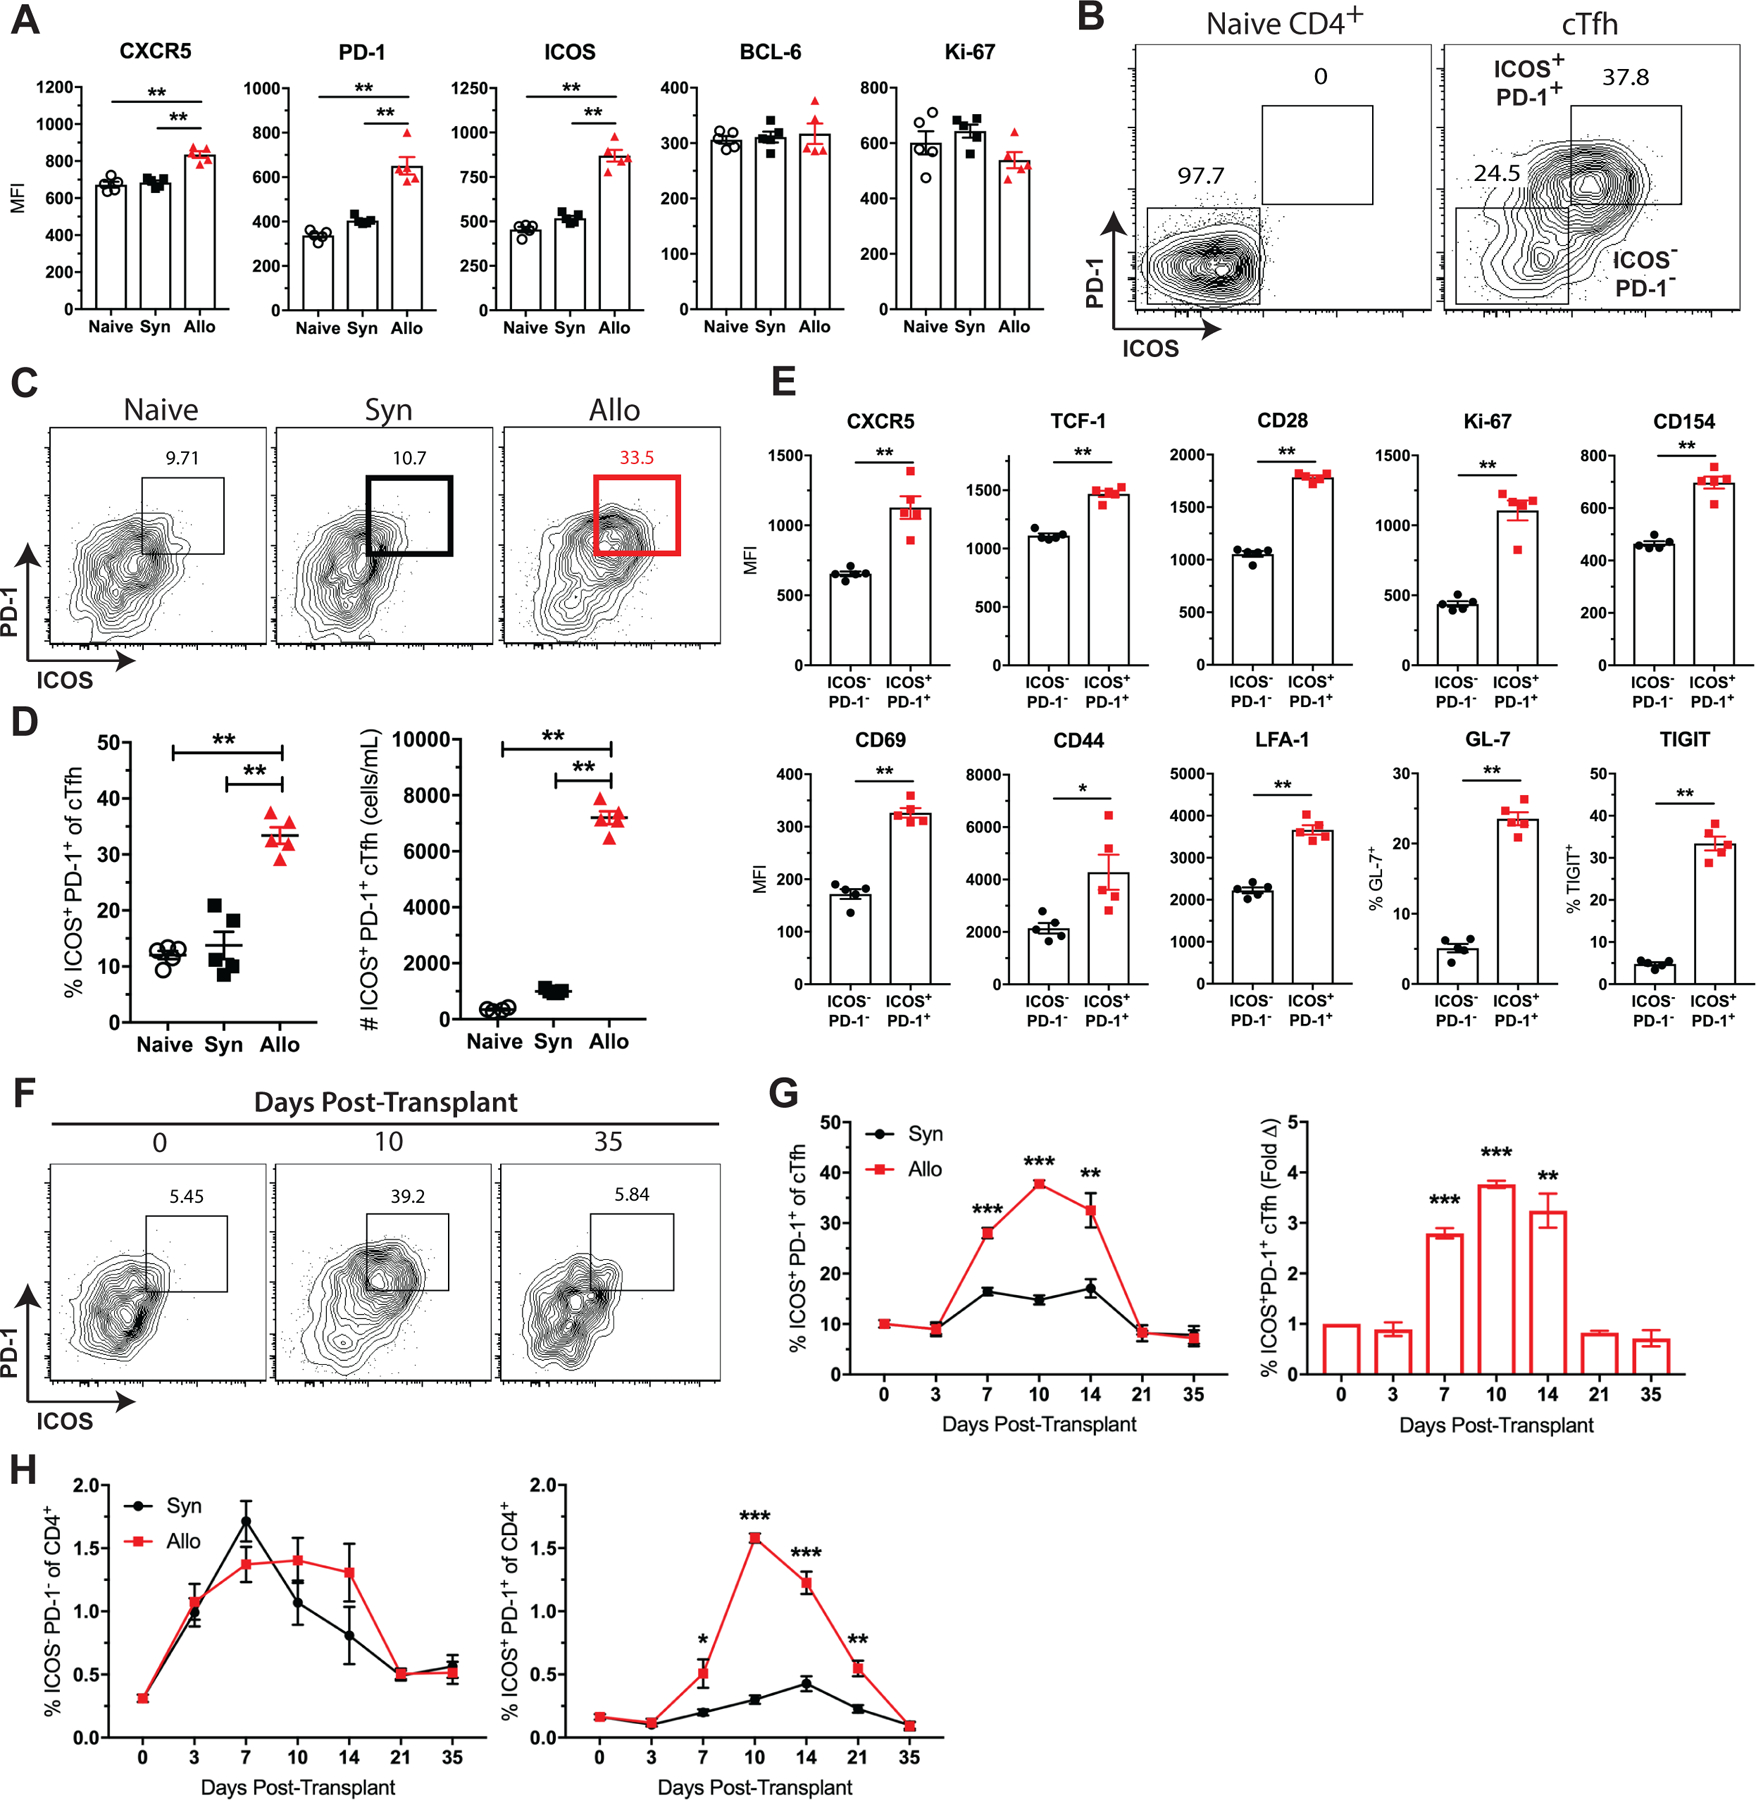
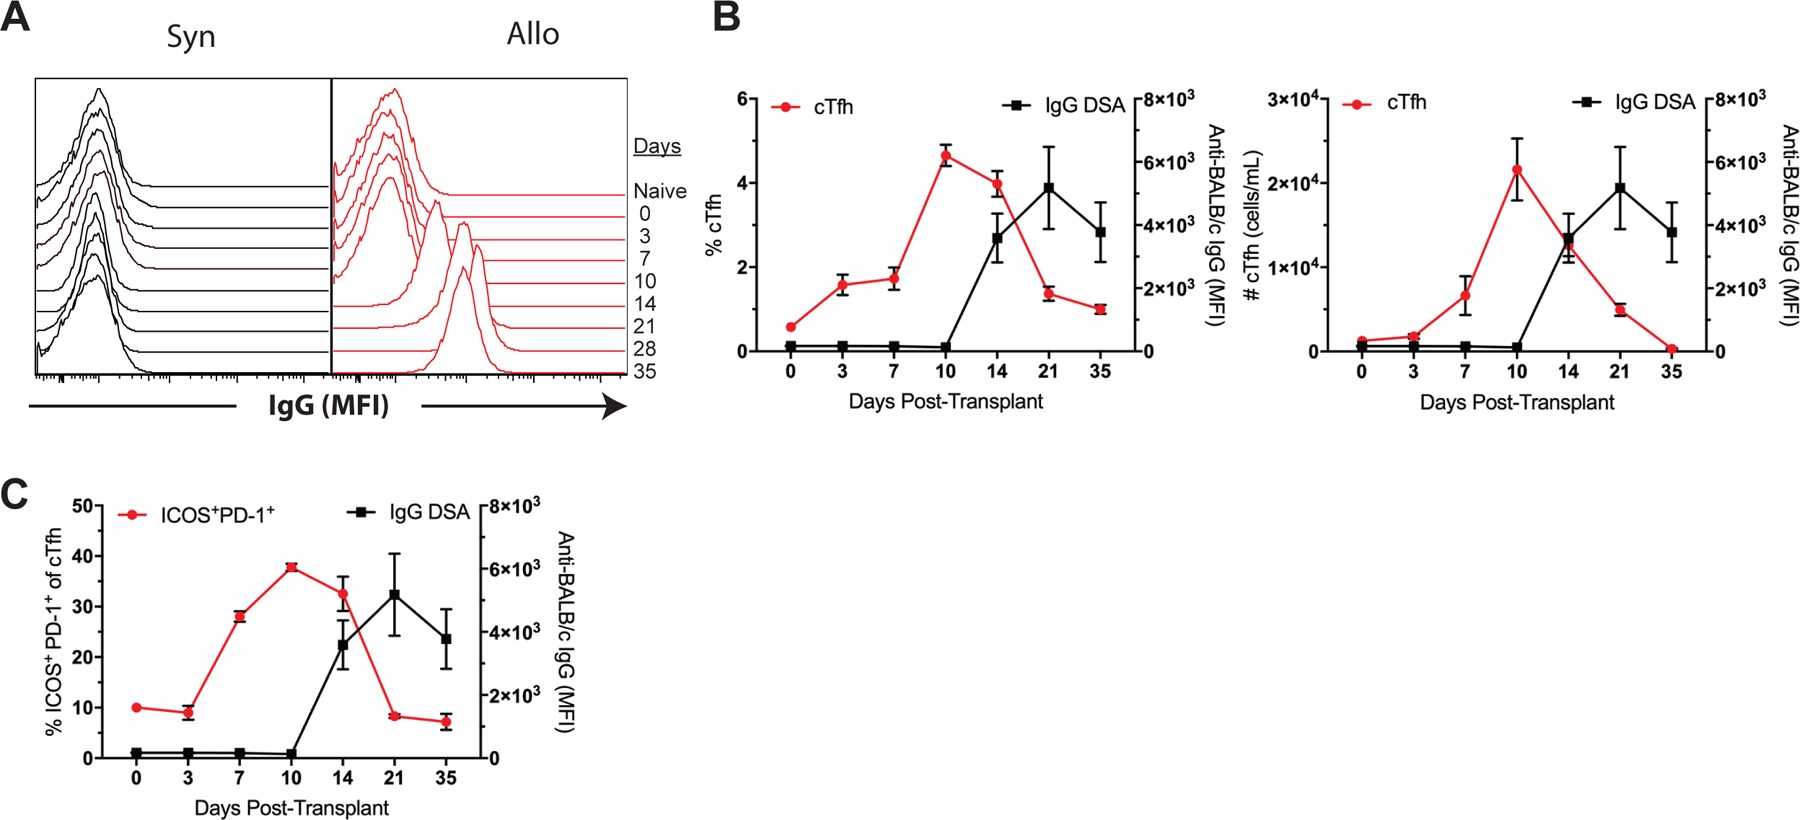
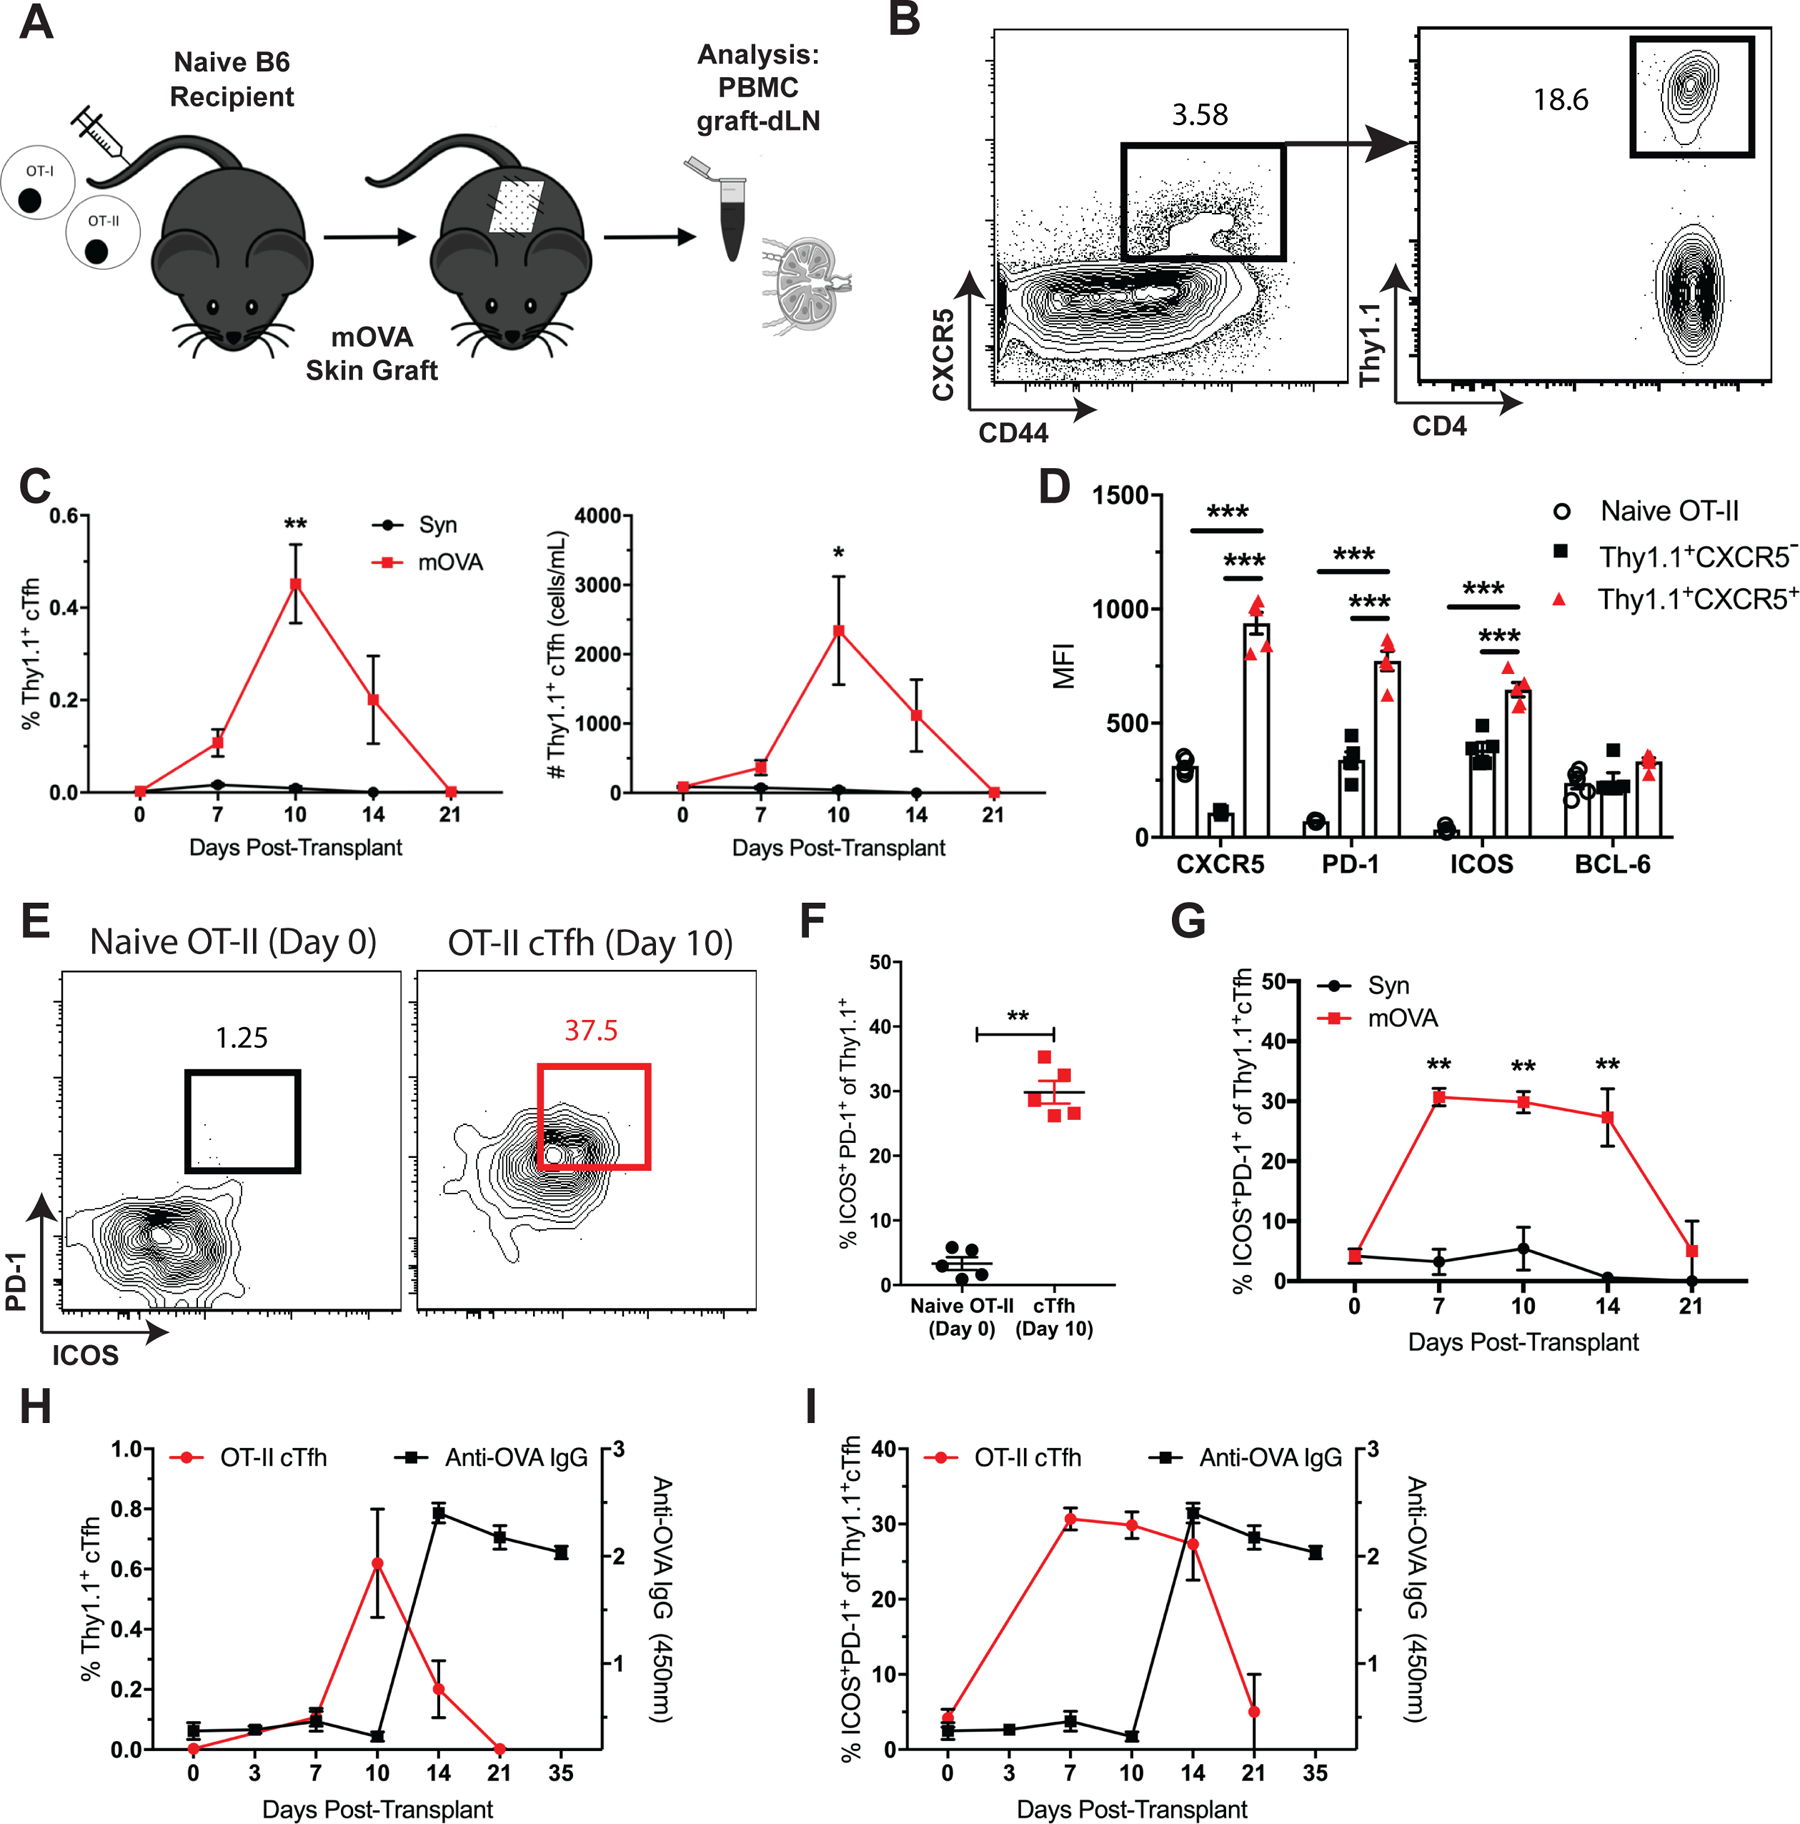
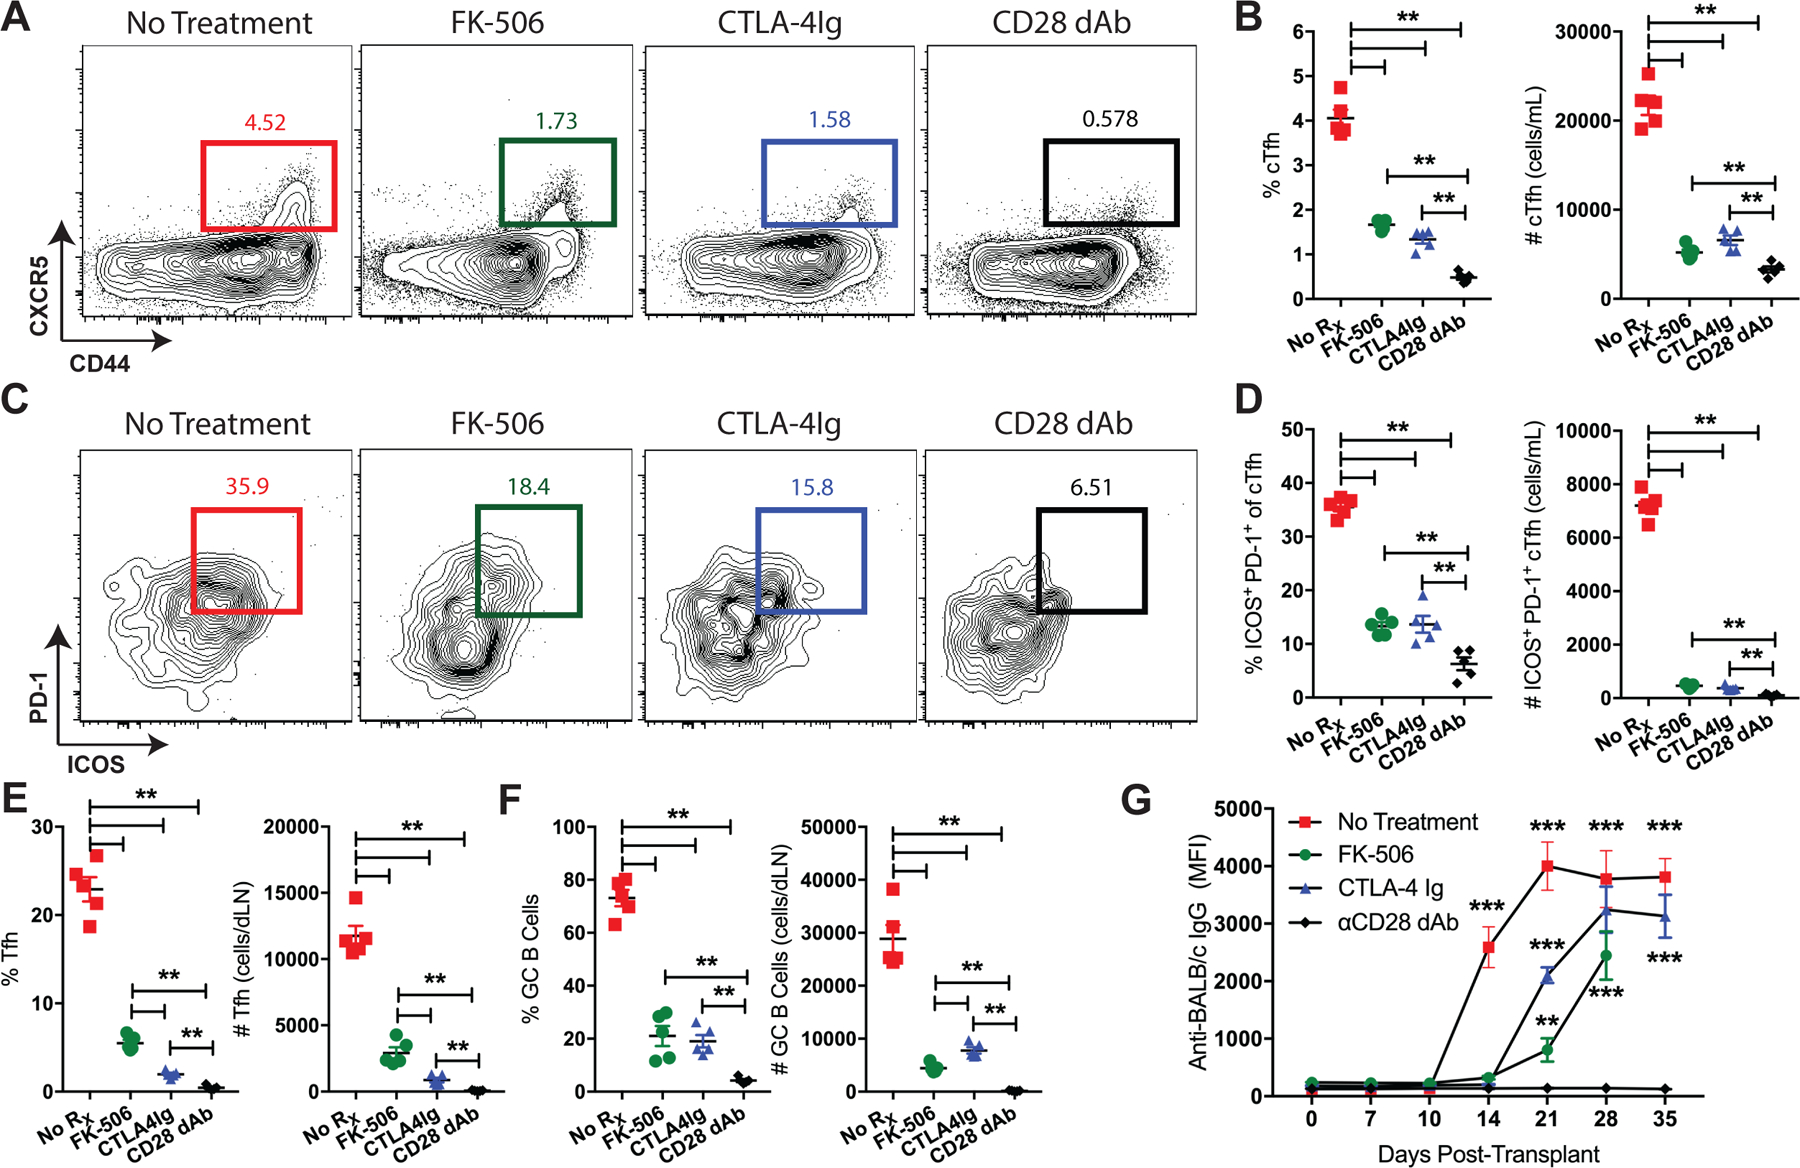
Donor-specific antibodies (DSAs) contribute to renal allograft loss. However, biomarkers to guide clinical management of DSA posttransplant or detect humoral alloimmune responses before alloantibodies develop are not available. Circulating T follicular helper (cTfh) cells are CD4+ CXCR5+ Tfh-like cells in the blood that have been associated with alloantibodies in transplant recipients, but whether they precede antibody formation for their evaluation as a predictive biomarker in transplant is unknown. To evaluate the ability of cTfh cells to predict DSA, we used murine transplant models to determine the temporal relationship between cTfh cells, germinal center formation, and DSA development. We observed that donor-reactive CD4+ CXCR5+ cTfh cells expand after allotransplant. These cTfh cells were equivalent to graft-draining lymph node-derived Tfh cells in their ability to provide B cell help for antibody production. cTfh cell expansion and differentiation into ICOS+ PD-1+ cells temporally correlated with germinal center alloreactivity and preceded the generation of DSAs in instances of modified and unmodified alloantibody formation. Importantly, delayed costimulation blockade initiated after the detection of ICOS+ PD-1+ cTfh cells prevented DSAs. These findings suggest that cTfh cells could serve as a biomarker for humoral alloreactivity before the detection of alloantibodies and inform therapeutic approaches to prevent DSAs.

Keywords: T cell biology; alloantibody; basic (laboratory) research/science; biomarker; costimulation; immune; immunobiology; immunosuppression/immune modulation; monitoring; translational research/science.


Conflict of interest statement

Disclosures

The authors of this manuscript have no conflicts of interest to disclose as described by the American Journal of Transplantation.

Figures

Figure 1.
Figure 1.. Circulating CXCR5+ CD4+ T cells expand following transplantation and display phenotypic and functional characteristics of cTfh cells.
(A) Naïve B6 mice were transplanted with skin from either B6 (Syn) or BALB/c (Allo) donors and sacrificed 10 days post-transplantation for PBMC and graft-dLN analysis. (B) Flow cytometric plots (gated on CD4+Foxp3 T cells) displaying the frequencies of CXCR5+ T cells. (C) Summary data of the frequencies and numbers of cTfh cells (n=5 per group). (D) Representative flow plots (gated on CD4+Foxp3 T cells) of blood-derived CXCR5+ (PBMC) and graft-dLN Tfh cells as defined by CXCR5 and PD-1. (E) Summary data of phenotypic marker expression by CXCR5+ PBMCs and graft-dLN Tfh cells (n=5 per group). (F) Flow plots (gated on CD4+Foxp3 T cells) depict gating strategy for naïve (CD44loCD62L+), antigen-experienced (CD44hiCXCR5) and CXCR5+ T cell populations with summary data of phenotypic marker expression by each subset, respectively (n=5 per group). (G) Representative flow plots (gated on CD19+IA-IE+ B Cells) displaying the frequencies of GC-like B cells following 6-day in vitro T:B cell co-culture from BALB/c transplanted mice. (H) Summary data of the frequencies of IgG+GL-7+ B cells and total IgG after T:B cell co-culture (n=3 with cells pooled from 5–10 mice). Summary data represent mean (SE) and are representative of 2–4 independent experiments with a total of 10–20 mice per group. *p < 0.05, **p < 0.01, ***p< 0.001.
Figure 2.
Figure 2.. Circulating Tfh cell kinetics parallel graft-dLN GC reactivity following transplantation.
Naïve B6 mice were transplanted with skin from either B6 (Syn) or BALB/c (Allo) donors and serially sacrificed post-transplantation for PBMC and graft-dLN analysis. (A) Representative flow plots displaying the frequencies of blood cTfh (gated on CD4+Foxp3 T cells), graft-dLN Tfh (gated on CD4+Foxp3CD44hi T cells), GC B (gated on CD19+IgDB220+CD138 B cells), plasmablast (gated on CD19+IgD cells), and plasma (gated on CD19IgD cells) cells over time. Summary data of (B) cTfh cell, (C) graft-dLN Tfh cell, (D) GC B cell, (E) plasmablast, and (F) plasma cell frequencies and numbers over time (n=5 per group). (G) Summary data of cTfh cell frequencies and numbers relative to graft-dLN Tfh and GC B cell frequencies and numbers, respectively (n=5 per group). Summary data represent mean (SE) and are representative of three independent experiments with a total of 15 mice per group. *p < 0.05, **p < 0.01, ***p< 0.001.
Figure 3.
Figure 3.. Donor-reactive cTfh cells exhibit an activated ICOS+PD-1+ phenotype after transplantation.
Naïve B6 mice were transplanted with skin from either B6 (Syn) or BALB/c (Allo) donors and sacrificed for PBMC analysis. (A) Summary data of phenotypic marker expression on cTfh cells from naïve, syngeneic and allogeneic skin-grafted mice ten days after transplant (n=5 per group). (B) Representative flow plots depicting ICOS and PD-1 expression on naïve (CD44loCD62L+) CD4+ T cells and CXCR5+ cTfh cells. (C) Representative flow plots (gated on CD4+Foxp3CXCR5+ T cells) displaying the frequencies of ICOS+PD-1+ cTfh cells. (D) Summary data of the frequencies and numbers of ICOS+PD-1+ cTfh cells (n=5 per group). (E) Summary data of phenotypic marker expression on ICOSPD-1 and ICOS+PD-1+ cTfh cells (n=5 per group). (F) Representative flow plots (gated on CD4+CXCR5+ T cells) displaying the frequencies of ICOS+PD-1+ cTfh cells over time. (G) Summary data of ICOS+PD-1+ cTfh cell frequencies and fold change over time (n=5 per group). (H) Summary data of ICOSPD-1 and ICOS+PD-1+ cTfh cell frequencies of CD4+ T cells over time. Summary data represent mean (SE) and are representative of 3–4 independent experiments with a total of 15–20 mice per group. *p < 0.05, **p < 0.01, ***p< 0.001.
Figure 4.
Figure 4.. Circulating Tfh cells precede DSA formation following transplantation.
Naïve B6 mice were transplanted with skin from either B6 (Syn) or BALB/c (Allo) donors and serially bled for serum collection and flow crossmatch analysis. (A) Representative histograms of anti-donor IgG in syngeneic and allogeneic skin-grafted mice over time. (B) Summary data of cTfh cell frequencies and numbers relative to anti-donor IgG over time (n=5 per group). (C) Summary data of ICOS+PD-1+ cTfh cell frequencies relative to DSA formation over time (n=5 per group). Summary data represent mean (SE) and are representative of three independent experiments with a total of 15 mice per group. *p < 0.05, **p < 0.01, ***p< 0.001.
Figure 5.
Figure 5.. Antigen-specific TCR transgenic cTfh cells display similar phenotypic characteristics and kinetics to endogenous alloreactive cTfh cells following transplantation.
(A) Naïve B6 mice were adoptively transferred 106 of each Thy1.1+ CD4+ OT-II and CD8+ OT-I T cells, transplanted skin from B6 (Syn) or mOVA donors and sacrificed at indicated time points post-transplantation for PBMC, graft-dLN and serum analyses. (B) Flow plots (gated on CD4+Foxp3 T cells) depict gating strategy for CXCR5+Thy1.1+ OVA-specific cTfh cells. (C) Summary data of Thy1.1+ cTfh cell frequencies and numbers following B6 (Syn) or mOVA skin transplantation over time (n=5 per group). (D) Summary data of phenotypic marker expression in naïve (CD44loCD62L+) OT-II cells, and Thy1.1+ CXCR5 or CXCR5+ OT-II cells from the peripheral blood 10 days post-transplantation (n=5 per group). (E) Flow plots depicting ICOS and PD-1 expression on naive OT-II cells on day 0 and Thy1.1+CXCR5+ cTfh cells 10 days post-transplantation. (F) Summary data of the frequencies of ICOS+PD-1+ of naïve OT-II cells on day 0 and Thy1.1+ cTfh cells 10 days after transplant (n=5 per group). (G) Summary data of ICOS+PD-1+ Thy1.1+ cTfh cell frequencies over time (n=5 per group). Summary data of (H) Thy1.1+ cTfh cell and (I) ICOS+PD-1+ Thy1.1+ cTfh cell frequencies relative to anti-OVA IgG formation over time (n=5 per group). Summary data represent mean (SE) and are representative of three independent experiments with a total of 10–15 mice per group. *p < 0.05, **p < 0.01, ***p< 0.001.
Figure 6.
Figure 6.. Circulating Tfh cells predict breakthrough alloantibodies despite immunosuppression.
Naïve B6 mice were transplanted with BALB/c skin grafts and treated with tacrolimus (FK-506), CTLA-4-Ig, anti-CD28 dAb, or left untreated. BALB/c-grafted mice were sacrificed 10 days post-transplant for PBMC and graft-dLN analysis and serially bled for DSA assessment. (A) Representative flow cytometric plots (gated on CD4+Foxp3 T cells) displaying the frequencies of CXCR5+ cTfh cells. (B) Summary data of the frequencies and numbers of cTfh cells (n=5 per group). (C) Representative flow plots (gated on CD4+Foxp3CXCR5+ T cells) displaying the frequencies of ICOS+PD-1+ cTfh cells. (D) Summary data of the frequencies and numbers of ICOS+PD-1+ cTfh cells (n=5 per group). Summary data of the frequencies and numbers of graft-dLN (E) Tfh and (F) GC B cells (n=5 per group). (G) Summary data of anti-donor IgG formation in treated or untreated BALB/c-grafted mice over time (n=5 per group). Summary data represent mean (SE) and are representative of three independent experiments with a total of 15 mice per group. *p < 0.05, **p < 0.01, ***p< 0.001.
Figure 7.
Figure 7.. Delayed anti-CD28 CoB initiated after detection of ICOS+PD-1+ cTfh cells prevents DSA formation.
Naïve B6 mice were transplanted BALB/c skin grafts and their blood serially monitored for the development of ICOS+PD-1+ cTfh cells. Once detected on post-transplant day 7, immunosuppression with anti-CD28 dAb was initiated. Representative flow plots (gated on CD4+Foxp3 T cells) displaying the frequencies of (A) cTfh and (B) ICOS+PD-1+ cTfh cells over time. Summary data of the frequencies and numbers of (C) cTfh and (D) ICOS+PD-1+ cTfh cells (n=5 per group). (E) Representative histograms of anti-donor IgG in untreated and delayed anti-CD28 dAb treated mice over time. (F) Summary data of anti-donor IgG over time (n=5 per group). Summary data represent mean (SE) and are representative of two independent experiments with a total of 10 mice per group. *p < 0.05, **p < 0.01, ***p< 0.001.

References

    1. Hart A, Smith JM, Skeans MA, Gustafson SK, Wilk AR, Robinson A, et al. OPTN/SRTR 2016 Annual Data Report: Kidney. Am J Transplant. 2018;18 Suppl 1:18–113. - PMC - PubMed
    1. Nankivell BJ, Borrows RJ, Fung CL, O’Connell PJ, Allen RD, Chapman JR. The natural history of chronic allograft nephropathy. N Engl J Med. 2003;349(24):2326–33. - PubMed
    1. Loupy A, Hill GS, Jordan SC. The impact of donor-specific anti-HLA antibodies on late kidney allograft failure. Nat Rev Nephrol. 2012;8(6):348–57. - PubMed
    1. Lefaucheur C, Loupy A, Hill GS, Andrade J, Nochy D, Antoine C, et al. Preexisting donor-specific HLA antibodies predict outcome in kidney transplantation. J Am Soc Nephrol. 2010;21(8):1398–406. - PMC - PubMed
    1. Wiebe C, Gibson IW, Blydt-Hansen TD, Karpinski M, Ho J, Storsley LJ, et al. Evolution and clinical pathologic correlations of de novo donor-specific HLA antibody post kidney transplant. Am J Transplant. 2012;12(5):1157–67. - PubMed

Publication types