

Immune system stimulation increases the plasma cysteine flux and whole-body glutathione synthesis rate in starter pigs1
- PMID: 31251357
- PMCID: PMC6736144
- DOI: 10.1093/jas/skz211
Immune system stimulation increases the plasma cysteine flux and whole-body glutathione synthesis rate in starter pigs1
Abstract
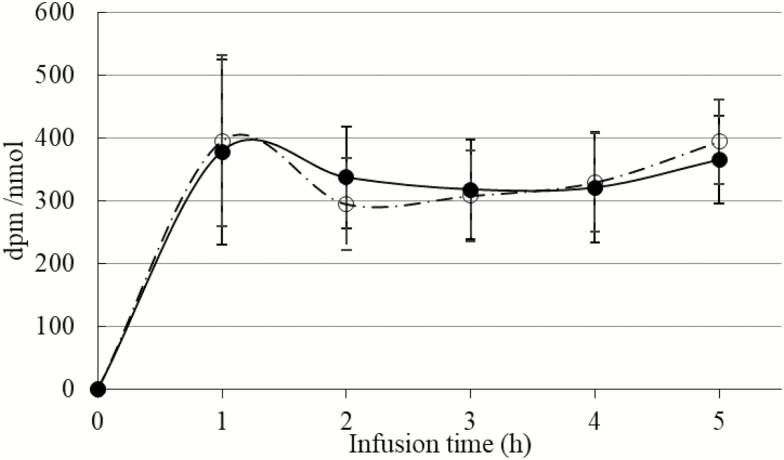
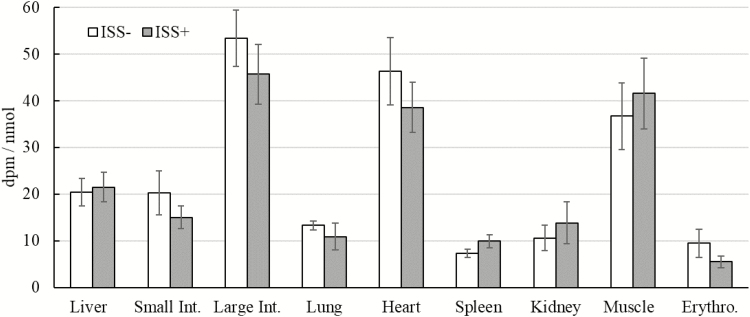
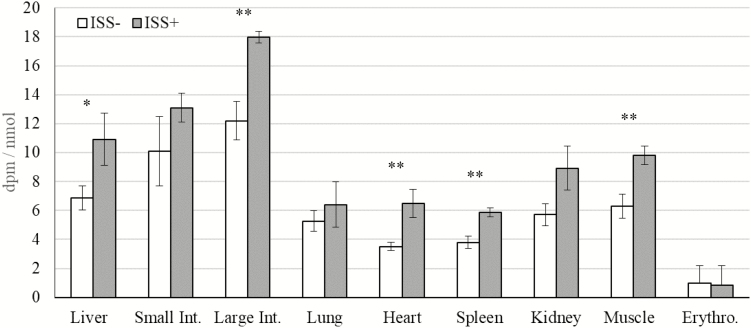
Glutathione (GSH) is the major intracellular thiol that plays a role in numerous detoxification, bio-reduction, and conjugation reactions. The availability of Cys is thought to be the rate-limiting factor for the synthesis of GSH. The effects of immune system stimulation (ISS) on GSH levels and the GSH synthesis rate in various tissues, as well as the plasma flux of Cys, were measured in starter pigs fed a sulfur AA (SAA; Met + Cys) limiting diet. Ten feed-restricted gilts with initial body weight (BW) of 7.0 ± 0.12 kg were injected i.m. twice at 48-h intervals with either sterile saline (n = 4; ISS-) or increasing amounts of Escherichia coli lipopolysaccharide (n = 6; ISS+). The day after the second injection, pigs received a primed constant infusion of 35S-Cys (9,300 kBq/pig/h) for 5 h via a jugular catheter. Blood and tissue free Cys and reduced GSH were isolated and quantified as the monobromobimane derivatives by HPLC. The rate of GSH synthesis was determined by measurement of the specific radioactivity of GSH and tissue free Cys at the end of the infusion period. Plasma Cys and total SAA levels were reduced (16% and 21%, respectively), but plasma Cys flux was increased (26%) by ISS (P < 0.05). Immune system stimulation increased GSH levels in the plasma (48%; P < 0.05), but had no effect on GSH levels in the liver, small and large intestines, heart, muscle, spleen, kidney, lung, and erythrocytes. The fractional synthesis rate (FSR) of GSH was higher (P < 0.05) in the liver (34%), small intestine (78%), large intestine (72%), heart (129%), muscle (37%), and erythrocytes (47%) of ISS+ pigs compared to ISS- pigs. The FSR of GSH tended (P = 0.08) to be higher in the lungs (45%) of ISS+ pigs than in ISS- pigs. The absolute rate of GSH synthesis was increased by ISS (mmol/kg wet tissue/d ± SE, ISS- vs. ISS+; P < 0.05) in the liver (5.22 ± 0.22 vs. 7.20 ± 0.59), small intestine (2.54 ± 0.25 vs. 4.52 ± 0.56), large intestine (0.61 ± 0.06 vs. 1.06 ± 0.16), heart (0.21 ± 0.03 vs. 0.48 ± 0.08), lungs (1.50 ± 0.10 vs. 2.90 ± 0.21), and muscle (0.21 ± 0.03 vs. 0.34 ± 0.04), but it remained unchanged in erythrocytes, the kidney, and the spleen (P > 0.80). The current findings suggest that GSH synthesis is increased during ISS, contributing to enhanced maintenance sulfur amino acid requirements in starter pigs during ISS.
Keywords: cysteine; glutathione; lipopolysaccharide; pig; synthesis rate.
© The Author(s) 2019. Published by Oxford University Press on behalf of the American Society of Animal Science. All rights reserved. For permissions, please e-mail: journals.permissions@oup.com.
Figures

References
-
- Breuillé D., and Obled C.. 2000. Cysteine and glutathione in catabolic states. In: Fürst P. and Young V., editors, Proteins, peptides and amino acids in enteral nutrition. Nestlé Nutrition Workshop Series Clinical and Performance Program. Karger Publishers, Basel Switzerland: Vol. 3, p. 173–198. doi:10.1159/000061807 - DOI - PubMed
-
- Cotgreave I. A., and Moldéus P.. 1986. Methodologies for the application of monobromobimane to the simultaneous analysis of soluble and protein thiol components of biological systems. J. Biochem. Biophys. Methods 13:231–249. doi:10.1016/0165-022X(86)90102-8 - PubMed
MeSH terms
Substances
LinkOut - more resources
Full Text Sources
Medical
Miscellaneous
