Observational Study
. 2019 Jun 28;14(6):e0218776.
doi: 10.1371/journal.pone.0218776. eCollection 2019.

Statistical framework for validation without ground truth of choroidal thickness changes detection

Affiliations
Observational Study

Statistical framework for validation without ground truth of choroidal thickness changes detection

Tiziano Ronchetti et al. PLoS One. .

Abstract

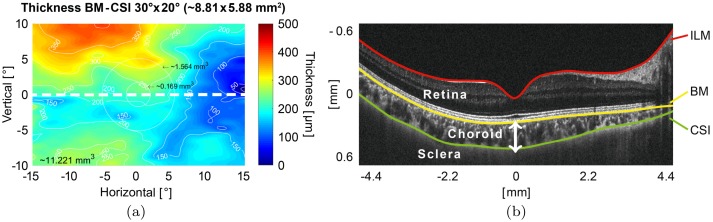
Monitoring subtle choroidal thickness changes in the human eye delivers insight into the pathogenesis of various ocular diseases such as myopia and helps planning their treatment. However, a thorough evaluation of detection-performance is challenging as a ground truth for comparison is not available. Alternatively, an artificial ground truth can be generated by averaging the manual expert segmentations. This makes the ground truth very sensitive to ambiguities due to different interpretations by the experts. In order to circumvent this limitation, we present a novel validation approach that operates independently from a ground truth and is uniquely based on the common agreement between algorithm and experts. Utilizing an appropriate index, we compare the joint agreement of several raters with the algorithm and validate it against manual expert segmentation. To illustrate this, we conduct an observational study and evaluate the results obtained using our previously published registration-based method. In addition, we present an adapted state-of-the-art evaluation method, where a paired t-test is carried out after leaving out the results of one expert at the time. Automated and manual detection were performed on a dataset of 90 OCT 3D-volume stack pairs of healthy subjects between 8 and 18 years of age from Asian urban regions with a high prevalence of myopia.


Conflict of interest statement

The authors have declared that no competing interests exist.

Figures

Fig 1
Fig 1. Choroidal thickness map and OCT B-scan with segmented layers.
(a) Visualization of the choroidal thickness (BM-CSI) including the choroid’s measured volume of a healthy right eye based on graph search algorithm. Circles indicate the location of the macula. The BM-CSI volume of the whole C-scan is indicated in the bottom left. (b) B-scan, a sagittal cross-section of the posterior eye segment through the retina, choroid and sclera, separated by the layers ILM, BM and CSI (source: Hydra, HuCE-optoLab/BUAS). The image was cut off in the vertical/z-direction for better visualization. The full A-scan length is 1.9 mm. The ILM is the Inner Limiting Membrane, while BM and CSI denote the Bruch’s Membrane and Choroid-Sclera Interface, respectively.
Fig 2
Fig 2. Sample screen of our online tool for manual expert segmentation.
According to the consensus between the experts, interconnecting tissues and vessels inside the sclera were ignored while the yellow segmentation line was continued on the side of the optical nerve horizontal. The pre-processing (filtering and histogram equalization) for better contrast during the task was activated in this case by the expert.
Fig 3
Fig 3. The calculation of the similarity measure BLD.
First, the minimum “forward” distance dmin(p,Ejs) between the point pEjs and the contour Ejs is determined, here marked as (1). Second, among all the points q on Ejs with a “inverse” minimum distance dmin-1(q,Ejs), those are selected whose minimal distance is found at the point p. Here, q and q˜ are the candidates, with the corresponding distances denoted by (2) and (3). Then, the maximum distance among the candidates, in this case (2), is chosen as dmax-1(Ejs,p). Finally, BLD(p,Ejs) is defined as the maximum between dmin(p,Ejs) and dmax-1(Ejs,p), in this example (2). For more details see [30].
Fig 4
Fig 4. The robustness of the BLD in comparison to the DC for contour recognition.
Here, the value of the surface delimited by the green contour is the same in both cases: (a) The region which should be recognized is an ellipse (black). (b) While the original contour was not recognized well at all, the DC for such a segmentation has yet the same high value as in (a). Using the BLD, we achieve a fairer evaluation of the segmentation, as the bad contour detection is taken into account and penalized with a higher value of the BLD (which corresponds to a minor similarity).
Fig 5
Fig 5. The representations of the intra-rater reliability of experts 1–6 ordered from (a)–(f).
At every pixel position, the difference to the average value of the three available segmentations per rater is calculated. If its absolute value is smaller than a predefined threshold (here set to 20 μm represented by the grey area) then it is counted, i.e. the prediction is considered reliable. Therefore, the narrower and higher the curve, the more reliable the segmentation by the corresponding expert is. The number of counts found within this range is divided by the total number of segmentation points graded by the corresponding expert. By the obtained normalized value IRCj we define the Intra-Rater Coefficient to quantify the reliability of the jth expert.
Fig 6
Fig 6. Examples of manual expert segmentation (consistent and less consistent with each other).
Top: Repeatability of (a) expert 2 and (b) expert 5 when segmenting the CSI. Bottom: Comparison of segmentations by (c) experts 3, 4 and 5 and (d) experts 1, 3 and 4. The choroidal area is subdivided in nasal (N)-temporal (T)/x-direction into five equidistant regions (patches) symmetrically around the foveal center: A (foveal region), B (parafoveal region), and C (perifoveal region). Here only cases of right eyes are depicted.
Fig 7
Fig 7. The values of the WI calculated for the algorithm and the experts group.
As similarity measures Jaccard, Dice, BLD and diffZ are used.
Fig 8
Fig 8. The average displacements of the CSI grouped by experts and algorithm.
The results are obtained by manual segmentation by the six experts and by CRAR (subdivided into the B-scan positions 1, 3, 6, 11, 13, 16, 21 and 23).
Fig 9
Fig 9. The average displacements of the CSI grouped by time intervals.
Above: The average displacements of the CSI detected by the expert group (a) and by CRAR (b) grouped by time intervals between the two measurements and subdivided into eight scan positions. Below: The average displacements of the CSI detected by the expert group (c) and by CRAR (d) grouped by time interval and subdivided in nasal-temporal/x-direction into five equidistant regions C-B-A-B-C (patches) symmetrically distributed around the foveal center, see Fig 6.

References

    1. Nickla DL, Wallman J. The multifunctional choroid. Progress in retinal and eye research. 2010;29(2):144–168. 10.1016/j.preteyeres.2009.12.002 - DOI - PMC - PubMed
    1. Chhablani J, Wong IY, Kozak I. Choroidal imaging: A review. Saudi Journal of Ophthalmology. 2014;28(2):123–128. 10.1016/j.sjopt.2014.03.004 - DOI - PMC - PubMed
    1. Chakraborty R, Read SA, Collins MJ. Diurnal variations in axial length, choroidal thickness, intraocular pressure, and ocular biometrics. Investigative ophthalmology & visual science. 2011;52(8):5121–5129. 10.1167/iovs.11-7364 - DOI - PubMed
    1. Ikuno Y, Kawaguchi K, Nouchi T, Yasuno Y. Choroidal thickness in healthy Japanese subjects. Investigative ophthalmology & visual science. 2010;51(4):2173–2176. 10.1167/iovs.09-4383 - DOI - PubMed
    1. Park KA, Oh SY. Choroidal thickness in healthy children. Retina. 2013;33(9):1971–1976. 10.1097/IAE.0b013e3182923477 - DOI - PubMed

Publication types