. 2019 Aug 22;47(14):7294-7305.
doi: 10.1093/nar/gkz555.

Transcriptome signature of cellular senescence

Affiliations

Transcriptome signature of cellular senescence

Gabriel Casella et al. Nucleic Acids Res. .

Erratum in

  • Transcriptome signature of cellular senescence.
    Casella G, Munk R, Kim KM, Piao Y, De S, Abdelmohsen K, Gorospe M. Casella G, et al. Nucleic Acids Res. 2019 Dec 2;47(21):11476. doi: 10.1093/nar/gkz879. Nucleic Acids Res. 2019. PMID: 31612919 Free PMC article. No abstract available.

Abstract

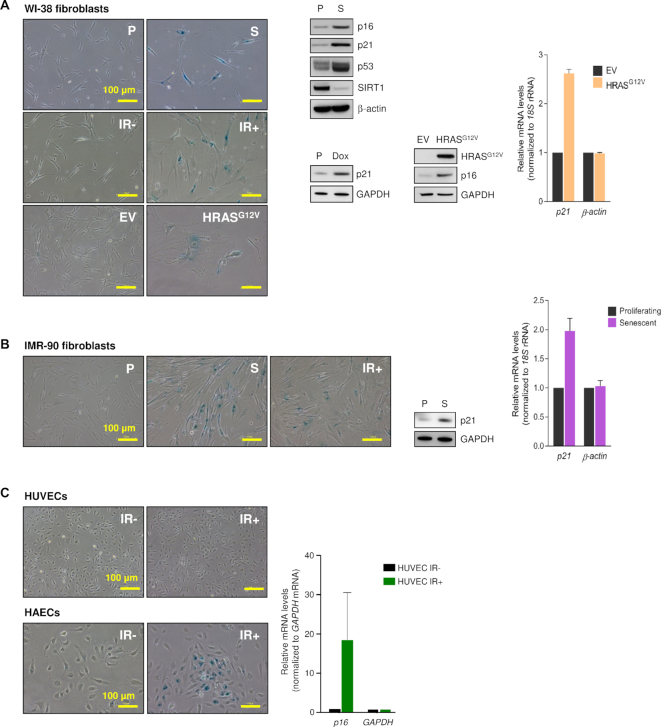
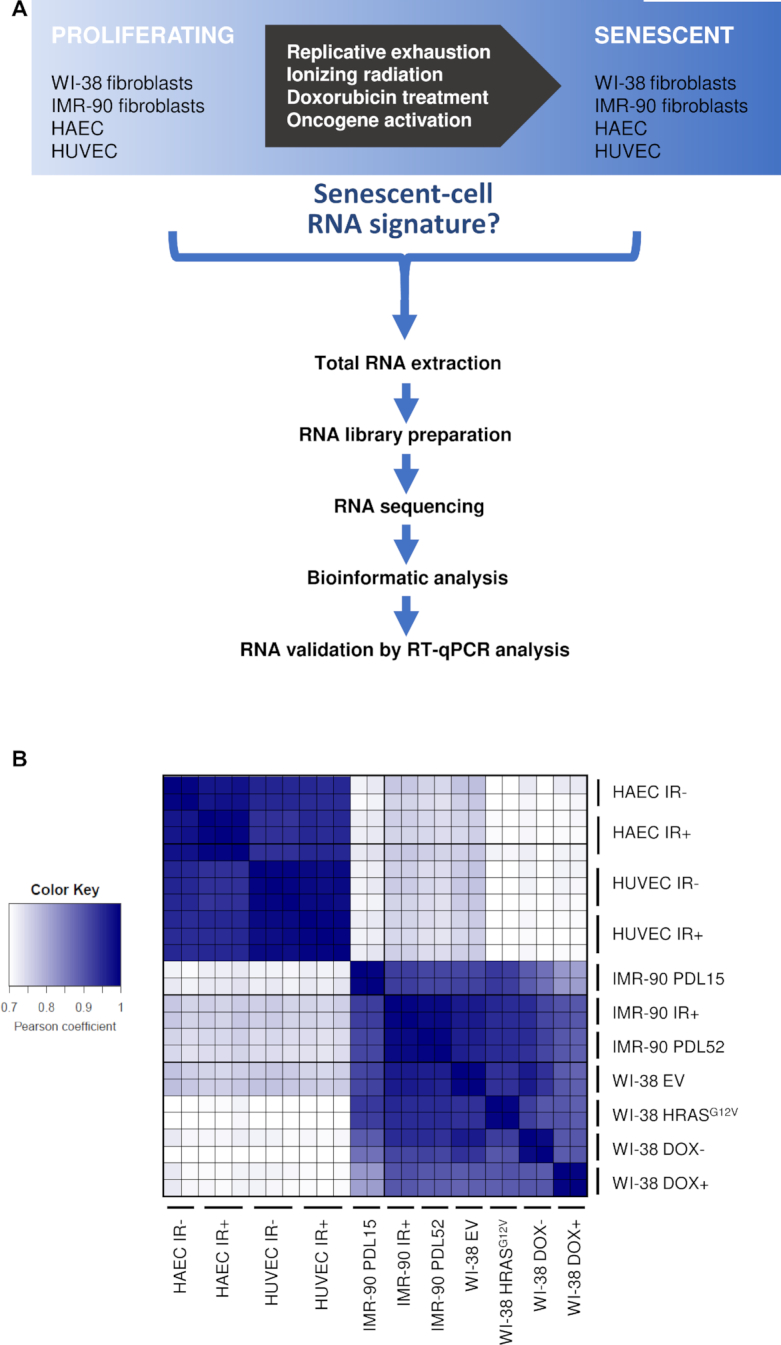
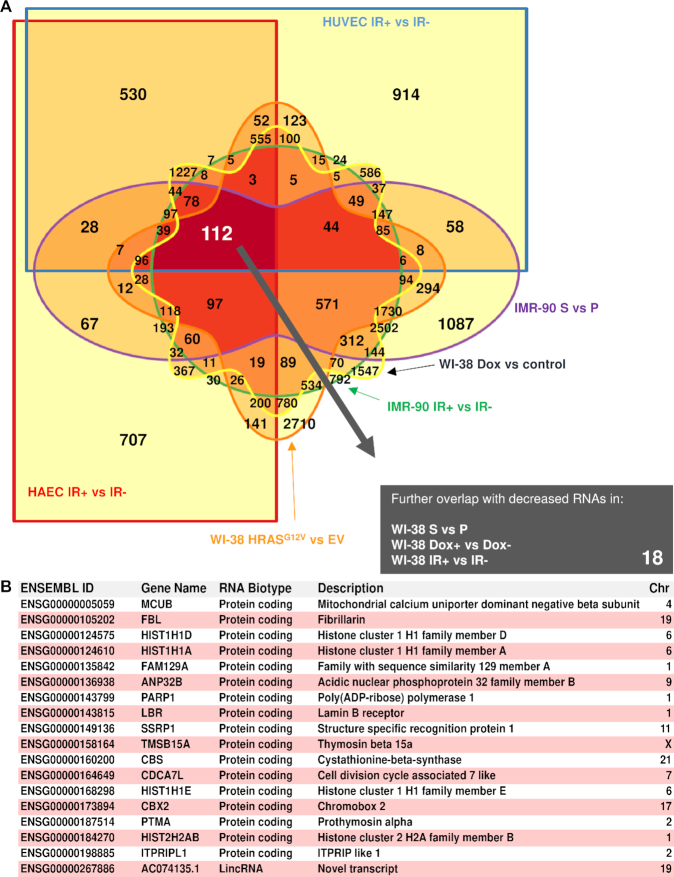
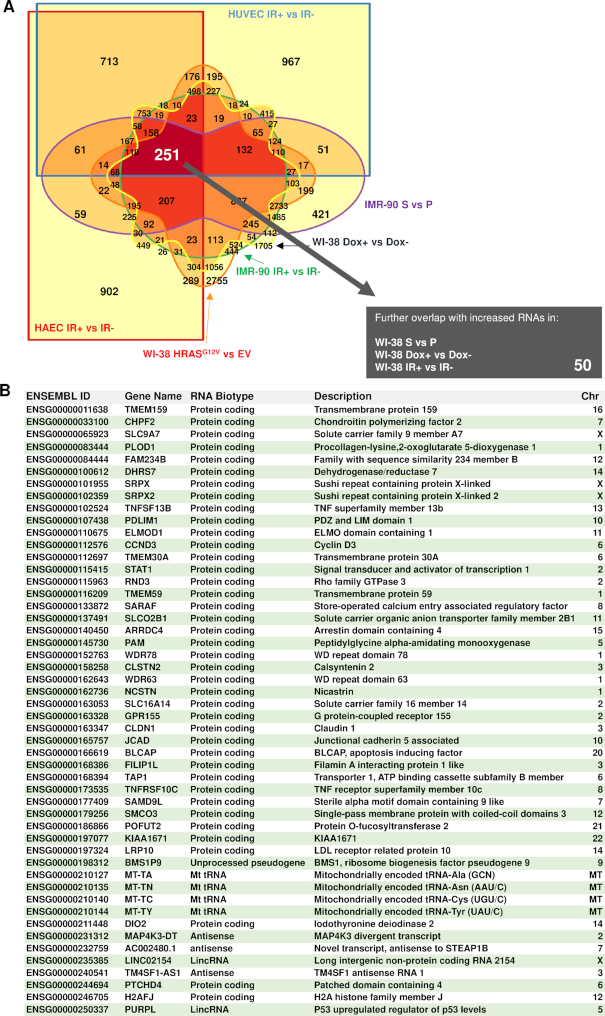
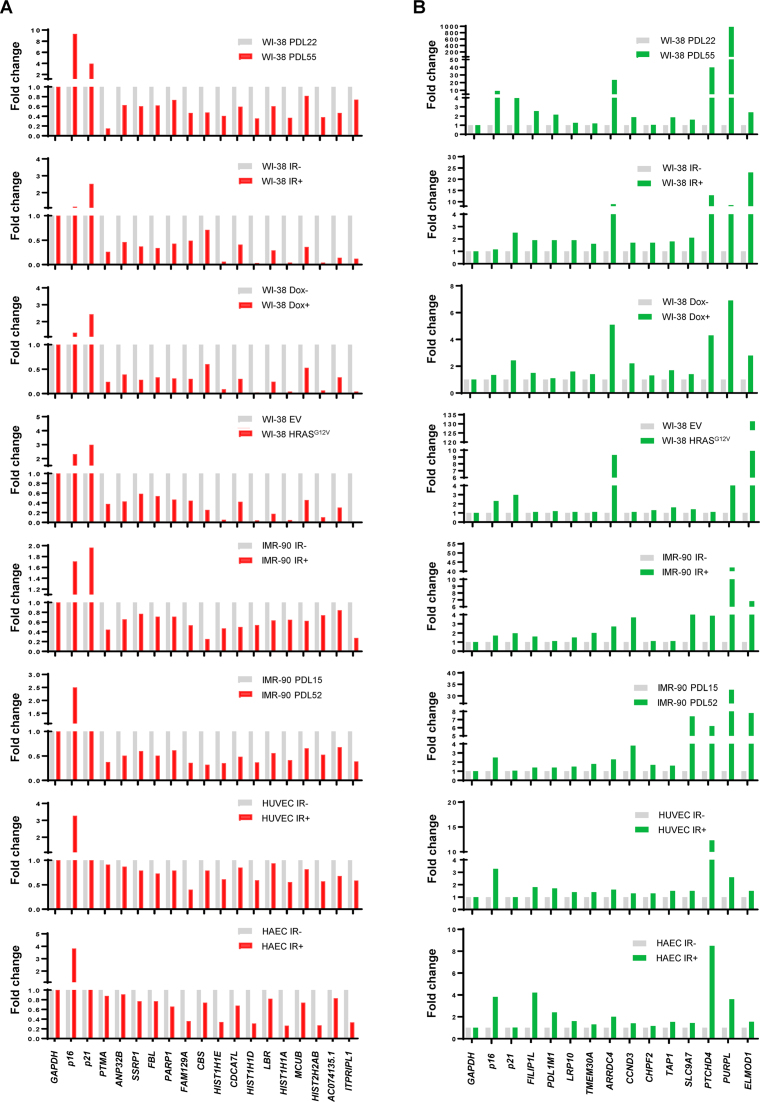
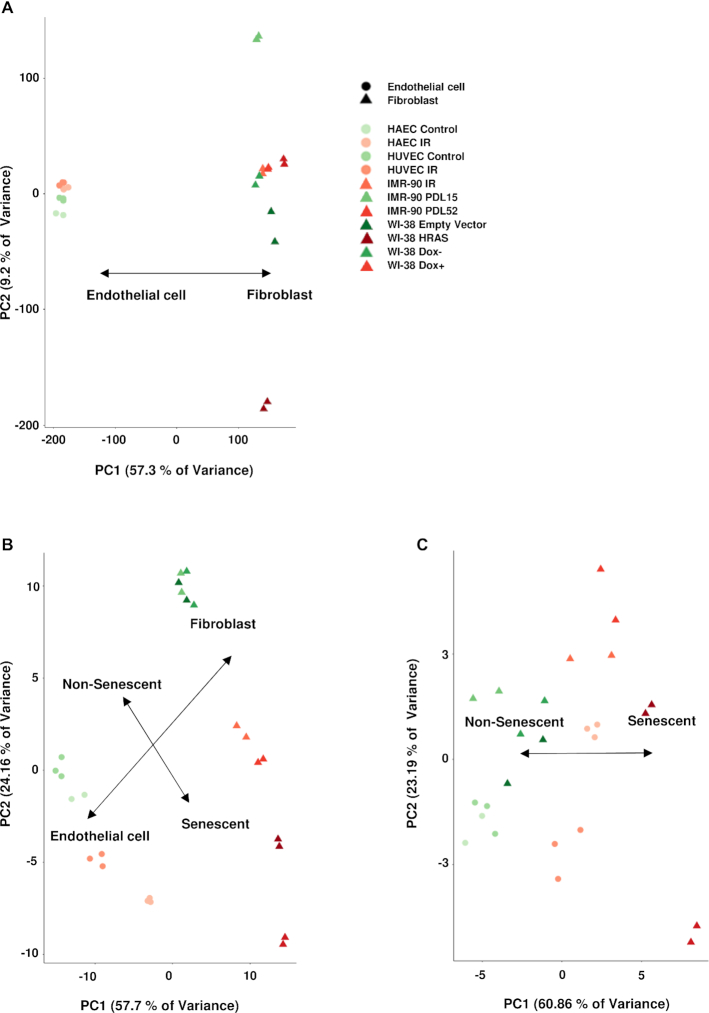
Cellular senescence, an integral component of aging and cancer, arises in response to diverse triggers, including telomere attrition, macromolecular damage and signaling from activated oncogenes. At present, senescent cells are identified by the combined presence of multiple traits, such as senescence-associated protein expression and secretion, DNA damage and β-galactosidase activity; unfortunately, these traits are neither exclusively nor universally present in senescent cells. To identify robust shared markers of senescence, we have performed RNA-sequencing analysis across eight diverse models of senescence triggered in human diploid fibroblasts (WI-38, IMR-90) and endothelial cells (HUVEC, HAEC) by replicative exhaustion, exposure to ionizing radiation or doxorubicin, and expression of the oncogene HRASG12V. The intersection of the altered transcriptomes revealed 50 RNAs consistently elevated and 18 RNAs consistently reduced across all senescence models, including many protein-coding mRNAs and some non-coding RNAs. We propose that these shared transcriptome profiles will enable the identification of senescent cells in vivo, the investigation of their roles in aging and malignancy and the development of strategies to target senescent cells therapeutically.


Figures

Figure 1.
Figure 1.
Senescence models. (A) The phenotype of proliferating WI-38 fibroblasts rendered senescent by extended culture [P (proliferating) cells at PDL25; S (senescent) cells at PDL50-59], exposure to ionizing radiation [IR-, proliferating; IR+, senescent by 10 days after exposure to 10 Gy] or expression of HRASG12V to trigger oncogene-induced senescence (OIS) [EV, proliferating cells expressing empty vector; HRASG12V cells expressing oncogenic RAS, 5 days after infection and selection with puromycin] was studied by assessing senescence-associated (SA)βGal activity (micrographs), by western blot analysis of senescence marker proteins showing higher (p16, p21, p53) or lower (SIRT1) levels with senescence (middle) or by RT-qPCR analysis of p21 mRNA levels (graph). WI-38 fibroblasts at PDL25 were treated with Doxorubicin (2 μg/ml for 24 h and harvested 5 days later; senescence was assessed by western blot analysis of p21 expression levels. (B) The phenotype of IMR-90 cells that were either proliferating (P) or were rendered senescent by replicative exhaustion (S) or exposure to IR (IR+) was assessed as explained in panel (A). (C) The senescent phenotype of proliferating (IR-) and senescent (IR+) HUVECs and HAECs (4 Gy, 10 days after exposure) was assessed by monitoring SA-βGal activity (micrographs) and p16 mRNA levels (graph). Data in graphs (A–C) represent the means ± S.E.M. from three independent experiments.
Figure 2.
Figure 2.
Study workflow. (A) Schematic representation of the workflow to trigger senescence. (B) Heat map of Pearson correlation coefficients to compare correlations between the samples, calculated using the log counts per million (CPM) of all the mapped transcripts from RNA-seq, where 1 is total positive linear correlation between two samples and 0 is no linear correlation.
Figure 3.
Figure 3.
Shared reduced RNAs in senescence. (A) Venn diagram of all the possible overlapping and non-overlapping transcripts in six comparison groups sequenced together, showing reduced abundance with senescence, filtering for a significance FDR < 0.15 (Benjamini–Hochberg P-value correction). Increasing color saturation indicates overlapping comparisons with largest number of RNAs; 112 RNAs were found to be downregulated in all six comparisons. (B) Table lists a final set of 18 reduced transcripts, after overlapping those 112 RNAs with three additional comparison groups of reduced RNAs using the same significance adjustments in WI-38 S versus P, WI-38 Dox+ versus Dox- and WI-38 IR+ versus IR-.
Figure 4.
Figure 4.
Shared increased RNAs in senescence. (A) Venn diagram of all the possible overlapping and non-overlapping transcripts in six comparison groups sequenced together, showing increased abundance with senescence, filtering for a significance FDR < 0.15 (Benjamini–Hochberg P-value correction). Increasing color saturation indicates overlapping comparisons with largest number of RNAs; 251 RNAs were found to be upregulated in all six comparisons. (B) Table lists a final set of 50 increased transcripts, after overlapping those 251 RNAs with three additional comparison groups of elevated RNAs using the same significance adjustments in WI-38 S versus P, WI-38 Dox+ versus Dox- and WI-38 IR+ versus IR-.
Figure 5.
Figure 5.
Validation of shared RNAs. RT-qPCR analysis showing the fold change of the relative abundance of RNA levels in a subset of shared decreased (A) and increased (B) transcripts normalized to GAPDH mRNA. p16 and p21 mRNAs were included as senescence positive controls. Data represent two biological replicates.
Figure 6.
Figure 6.
Senescence versus non-senescence discrimination. (A) Principal component analysis (PCA) calculated using the normalized log counts per million (CPM) of all aligned transcripts. (B) PCA of the same group of samples when considering only the 68 transcripts with shared reduced (18) or increased (50) expression in all models of senescence studied. (C) PCA of the same group of samples when only considering SLCO2B1, CLSTN2 and PTCHD4 mRNAs, as well as LINC02154 and PURPL lncRNAs in the analysis.

References

    1. Hayflick L. The limited in vitro lifetime of human diploid cell strains. Exp. Cell Res. 1965; 37:614–636. - PubMed
    1. Dimri G.P., Lee X., Basile G., Acosta M., Scott G., Roskelley C., Medrano E.E., Linskens M., Rubelj I., Pereira-Smith O. et al. .. A biomarker that identifies senescent human cells in culture and in aging skin in vivo. Proc. Natl. Acad. Sci. U.S.A. 1995; 92:9363–9367. - PMC - PubMed
    1. Campisi J. Cellular senescence as a tumor-suppressor mechanism. Trends Cell Biol. 2001; 11:S27–S31. - PubMed
    1. Zhang R., Adams P.D.. Heterochromatin and its relationship to cell senescence and cancer therapy. Cell Cycle. 2007; 6:784–789. - PubMed
    1. Panda A.C., Abdelmohsen K., Gorospe M.. SASP regulation by noncoding RNA. Mech. Ageing Dev. 2017; 168:37–43. - PMC - PubMed

Publication types

MeSH terms