. 2019 Jun 27;178(1):107-121.e18.
doi: 10.1016/j.cell.2019.06.001.

Pervasive Chromatin-RNA Binding Protein Interactions Enable RNA-Based Regulation of Transcription

Affiliations

Pervasive Chromatin-RNA Binding Protein Interactions Enable RNA-Based Regulation of Transcription

Rui Xiao et al. Cell. .

Abstract

Increasing evidence suggests that transcriptional control and chromatin activities at large involve regulatory RNAs, which likely enlist specific RNA-binding proteins (RBPs). Although multiple RBPs have been implicated in transcription control, it has remained unclear how extensively RBPs directly act on chromatin. We embarked on a large-scale RBP ChIP-seq analysis, revealing widespread RBP presence in active chromatin regions in the human genome. Like transcription factors (TFs), RBPs also show strong preference for hotspots in the genome, particularly gene promoters, where their association is frequently linked to transcriptional output. Unsupervised clustering reveals extensive co-association between TFs and RBPs, as exemplified by YY1, a known RNA-dependent TF, and RBM25, an RBP involved in splicing regulation. Remarkably, RBM25 depletion attenuates all YY1-dependent activities, including chromatin binding, DNA looping, and transcription. We propose that various RBPs may enhance network interaction through harnessing regulatory RNAs to control transcription.

Keywords: RBP-TF co-occupancy; RNA-based transcriptional control; RNA-binding proteins; YY1-mediated DNA looping; chromatin binding; functional genomics.


Conflict of interest statement

DECLARATION OF INTERESTS

The authors declare no competing financial interests.

Figures

Figure 1.
Figure 1.. General Features of Chromatin-Associated RBPs
(A) Summary of RBPs surveyed by ChIP-seq in HepG2 and K562 cells. The 25 RBPs that produced high-quality ChIP-seq data are grouped into five classes: (1) hnRNP proteins, (2) SR proteins, (3) TFs that bind RNA, (4) proteins containing RNA-binding motif (RBM), and (5) others. Dark blue, high-quality data that met the ENCODE standards and showed a minimal number (≥200) of specific binding peaks; light blue, ChIP-seq data that met all other ENCODE standards except for sequencing depth (<10 million non-redundant reads) or the number of specific binding peaks (<200); gray, no signal enrichment after IP despite efficient IP detected by western blot; white, not investigated. (B) A typical genomic region displaying annotated gene structures and four key chromatin features determined by ENCODE on HepG2 cells. The ChromHMM segments highlighted by red and orange correspond to promoters and enhancers, respectively. (C) Circos plot showing the relationship between collective RBP-chromatin interactions, open chromatin regions detected by DNase I hypersensitivity, and key histone modification events in HepG2 cells. Chromosome 20 is magnified to illustrate positive and negative correlations with key histone modification events. (D) Coverage of individual histone modification events by chromatin-associated RBPs in HepG2 and K562 cells and the accumulative coverage of all chromatin regions associated with at least one biochemical activity (red line). (E) RBP occupancy on specific states of ENCODE-annotated genome segmentation in HepG2 cells. The seven states of segmentation are: R, repressive regions; PF, promoter flanking regions; T, transcribed regions; CTCF, CTCF-binding sites; WE, weak enhancers; E, enhancers; TSSs, transcription start sites/promoters. For each RBP, the relative distribution of its occupied sites on individual segments (vertical comparison) is color coded (key on the left). For each class of segment annotation, the relative distribution of individual RBPs is represented by bubble size (horizontal comparison), as indicated by each RBP’s Z score. Right: summed percentage of individual segment annotations covered by the surveyed RBPs. See also Figure S1 and Tables S1 and S2.
Figure 2.
Figure 2.. Distinct RBP-Chromatin Interaction Patterns on Different Promoter Classes
(A) Collective RBP preference for promoter subgroups segregated by sequence context (with or without CpG islands) or histone modification features, such as bivalent promoters marked by both H3K4me3 and H3K27me3 signals, promoters containing only H3K4me3 or H3K27me3 signals. Right: key for relative enrichment. (B) Relative occupation frequencies of individual RBPs on different classes of gene promoters. (C) The distribution of RBP ChIP-seq peaks among the six classes of small RNA gene promoters relative to background distribution. (D) Composite RBP-binding signals around TSSs. RBPs are ordered based on their relative positions of signal maxima to TSS. (E) Jaccard index for cell-type conservation of RBP-chromatin interactions between HepG2 and K562 cells (see Method Details). RBP occupation in genic regions are segregated according to expression levels: Exp (0), non-expressed; Exp (L), lowly expressed (bottom third of expressed genes); Exp (M), expressed at intermediate levels (middle third of expressed genes); Exp (H), highly expressed (top third of expressed genes). See also Figure S2 and Table S2.
Figure 3.
Figure 3.. Correlation between RBP-Promoter Interaction and Gene Expression
(A) Correlation between the probability of RBP association with promoters and target gene transcription activities profiled by GRO-seq in HepG2 cells (left); response to knockdown of individual RBPs profiled by RNA-seq (middle) or GRO-seq (right). Significantly up- or down-regulated genes are determined by adjusted p value of ≤0.05 and fold-change of ≤2/3 or ≥3/2. (B) Odds ratio of transcriptional response determined by GRO-seq on RBP-occupied promoters compared to non-occupied promoters. Right: definition of odds ratio. *p < 0.05 (Fisher’s exact test). (C) Comparison between changes in gene expression profiled by RNA-seq and GRO-seq upon knockdown of the three representative RBPs. (D) The distribution of RNA nuclear retention index (nuclear/(nuclear+cytoplasmic)) for each group of genes whose promoters were occupied by different RBPs. (E) Variable importance determined by Random Forest to evaluate the prediction power of each variable (see Method Details). Top ten RBPs are shown. (F) The distribution of RNA nuclear retention for genes with or without evidence for binding of RBM25 on their promoters. See also Figure S3 and Tables S2–S4.
Figure 4.
Figure 4.. Integrated Analysis of Chromatin-Associated RBPs and TFs in HepG2 Cells
(A) Segregation of chromatin-associated RBPs and TFs into 17 groups by NMF-inferred coefficient matrixes (see Method Details). (B) Coverage and annotation of total cis-regulatory elements (CREs, defined in Figure 1E) by individual NMF groups (left). Un, unannotated regions. Fractions of different CREs occupied by each group are shown on the right. (C) Representative NMF-segregated groups. Blue line, known physical interactions between members in each group annotated by GeneMANIA. (D) Preferential association of RBPs with HOT regions. RBPs are segregated into four quartiles (gray lines) based on their relative binding in HOT promoter regions. y axis: the percentage of total peaks that fall into HOT regions. (E) Top: co-localization of RBM25, XRCC5, and YY1 in HepG2 cells. Each fraction of the Venn diagram was further quantified as the percentage of peaks for each RBP, based on which individual pairwise co-localization was calculated. Bottom: the distribution of the core YY1-binding motif relative to YY1, RBM25, and YY1-binding peaks. The number of TSSs and their percentage associated with the core YY1-binding motif are indicated in each case. See also Figure S4 and Table S2.
Figure 5.
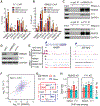
Figure 5.. Co-regulation of Gene Expression by YY1 and RBM25 in HepG2 Cells
(A and B) ChIP-qPCR analysis of YY1 (A) and RBM25 (B) binding on representative target gene promoters upon DRB treatment and after DRB washout. Data are presented as mean ± SD (n = 3). *p < 0.05, **p < 0.01, ***p < 0.001 (unpaired Student t test). (C) Reciprocal coIP of RBM25 and YY1 in an RNA-independent manner. (D) Efficient knockdown of RBM25 or YY1 without affecting the other protein. (E) RBM25 and YY1 ChIP-seq profiles on the two representative genic loci, one for up-regulated (left) and one for down-regulated (right) genes, as determined by GRO-seq. (F) Global comparison of transcriptional responses to knockdown of RBM25 and YY1. Spearman’s correlation coefficient (SCC) of fold-changes (FCs) is indicated. (G) Overlap of differentially expressed genes in HepG2 cells depleted of RBM25 or YY1. The colored boxes and line types separately denote gene expression events up (red box)- or down (blue box)-regulated by RBM25 (solid line) or YY1 (dashed line). (H) Positive association of RBM25 and YY1 binding at target gene promoters with induced gene expression determined by odds ratio. ***p < 0.001 (Fisher’s exact test). See also Figure S5 and Tables S5 and S6.
Figure 6.
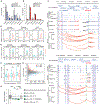
Figure 6.. RBM25-Dependent YY1 Binding in the Human Genome
(A and B) ChIP-qPCR analysis of YY1 (A) and RBM25 (B) binding on representative target gene promoters upon knockdown of the other factor. (C) Representative genomic loci showing down-regulated YY1 binding (ChIP-seq) and YY1-mediated chromatin looping (BL-Hi-C), as well as down (upper)-/up (lower)-regulated gene expression (insert numbers: expression levels measured by GRO-seq under individual conditions) upon knockdown of RBM25. Shaded regions highlight decreased interactions between the target gene promoter (green) and their enhancers (blue). (D and E) Metagene analysis of RBM25 (D) or YY1 (E) ChIP-seq signals on promoters (left), enhancers (middle), and CTCF-binding sites (right) with or without evidence for YY1 (D) or RBM25 (E) binding and before (blue) or after (red) knockdown of YY1 (D) or RBM25 (E). (F) Statistical analysis of the impact of RBM25 depletion on YY1 binding on all genomic loci without or with evidence for RBM25 occupancy. (G) Using all annotated promoters as anchors, the log2-fold change of normalized PETs frequency upon knockdown of RBM25 is plotted against normalized PETs frequency in control sample. Highlighted are YY1-bound promoters with significantly increased (red) or decreased (blue) interactions. (H) Gene promoters are subdivided into four different classes and separately analyzed for their interactions with active enhancers before and after RBM25 knockdown. The distribution of the log2-fold change of normalized PETs frequency is shown as boxplot (see Method Details). P, promoter; E, enhancer. *p < 0.05, **p < 0.01, ***p < 0.001 (unpaired Student t test). See also Figure S6 and Tables S5 and S6.

References

    1. Akdemir KC, and Chin L (2015). HiCPlotter integrates genomic data with interaction matrices. Genome Biol. 16, 198. - PMC - PubMed
    1. Aso T, Vasavada HA, Kawaguchi T, Germino FJ, Ganguly S, Kitajima S, Weissman SM, and Yasukochi Y (1992). Characterization of cDNA for the large subunit of the transcription initiation factor TFIIF. Nature 355, 461–464. - PubMed
    1. Baltz AG, Munschauer M, Schwanhäusser B, Vasile A, Murakawa Y, Schueler M, Youngs N, Penfold-Brown D, Drew K, Milek M, et al. (2012). The mRNA-bound proteome and its global occupancy profile on protein-coding transcripts. Mol. Cell 46, 674–690. - PubMed
    1. Bao X, Guo X, Yin M, Tariq M, Lai Y, Kanwal S, Zhou J, Li N, Lv Y, Pulido-Quetglas C, et al. (2018). Capturing the interactome of newly transcribed RNA. Nat. Methods 15, 213–220. - PMC - PubMed
    1. Barutcu AR, Maass PG, Lewandowski JP, Weiner CL, and Rinn JL (2018). A TAD boundary is preserved upon deletion of the CTCF-rich Firre locus. Nat. Commun 9, 1444. - PMC - PubMed

Publication types