Review
. 2019 Jun 27;9(7):123.
doi: 10.3390/metabo9070123.

NMR Spectroscopy for Metabolomics Research

Affiliations
Review

NMR Spectroscopy for Metabolomics Research

Abdul-Hamid Emwas et al. Metabolites. .

Abstract

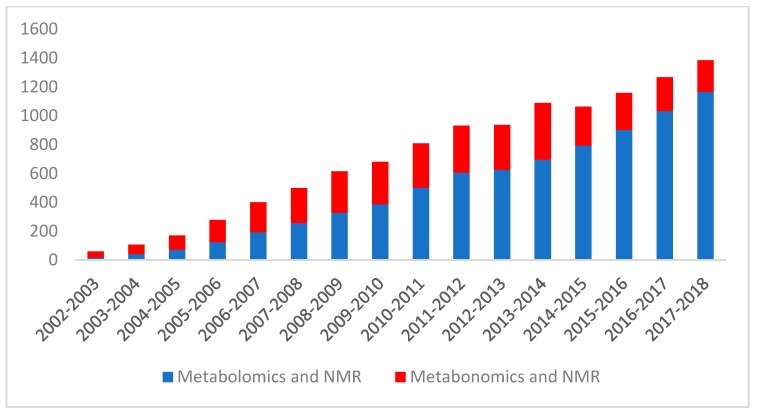
Over the past two decades, nuclear magnetic resonance (NMR) has emerged as one of the three principal analytical techniques used in metabolomics (the other two being gas chromatography coupled to mass spectrometry (GC-MS) and liquid chromatography coupled with single-stage mass spectrometry (LC-MS)). The relative ease of sample preparation, the ability to quantify metabolite levels, the high level of experimental reproducibility, and the inherently nondestructive nature of NMR spectroscopy have made it the preferred platform for long-term or large-scale clinical metabolomic studies. These advantages, however, are often outweighed by the fact that most other analytical techniques, including both LC-MS and GC-MS, are inherently more sensitive than NMR, with lower limits of detection typically being 10 to 100 times better. This review is intended to introduce readers to the field of NMR-based metabolomics and to highlight both the advantages and disadvantages of NMR spectroscopy for metabolomic studies. It will also explore some of the unique strengths of NMR-based metabolomics, particularly with regard to isotope selection/detection, mixture deconvolution via 2D spectroscopy, automation, and the ability to noninvasively analyze native tissue specimens. Finally, this review will highlight a number of emerging NMR techniques and technologies that are being used to strengthen its utility and overcome its inherent limitations in metabolomic applications.

Keywords: GC-MS; LC-MS; MS; NMR; analytical platform; metabolomics; resolution; sensitivity.


Conflict of interest statement

The authors declare no conflict of interest.

Figures

Figure 1
Figure 1
Increasing trend in the NMR-based metabolomics/metabonomics publications obtained using the keywords metabolomics and NMR (blue) or metabonomics and NMR (red) from the web of knowledge (http://apps.webofknowledge.com).
Figure 2
Figure 2
The electromagnetic nature of the NMR spectroscopy of the most common nuclei for metabolomics studies. (A) Frequency scale ranges and types of spectroscopies that correspond to them. The NMR frequency range for the most commonly used nuclei at 600 MHz proton frequency along with the natural abundances of the nuclei are also given. (B) Typical ppm ranges for the 15N, 13C, 31P, 19F, and 1H nuclei under different chemical environments.
Figure 3
Figure 3
Annotated 1D 1H NMR spectrum collected of NIST SRM-1950 human serum (ultrafiltered with a 3 kDa MW cutoff filter) at 700 MHz. The NIST SRM-1950 sample is a pooled human serum sample collected from a large number of volunteers and distributed by the National Institute of Standards. The identified compounds are labeled above each of the corresponding peaks. The high lactate peak is due the fact that the sample had not been metabolically quenched by NIST during its preparation, leading to the conversion of glucose to lactate.
Figure 4
Figure 4
Demonstration of magnetic field strength and probe specificity on spectral resolution of bovine serum recorded with the same parameter set on three spectrometers working at 500, 700, and 950 MHz proton frequencies at 25 °C. The probes used are the Bruker TCI—Triple Resonance CryoProbe on the 700 MHz and 950 MHz instruments and a Bruker BBFO on a 500 MHz magnet.
Figure 5
Figure 5
Detection of nearly 200 carboxyl-containing metabolites in urine by 2D 1H-15N heteronuclear single quantum correlation spectroscopy (HSQC) NMR after tagging with 15N isotope containing ethanolamine [46].
Figure 6
Figure 6
2D 1H−13C HSQC NMR spectrum of sucrose from the Biological Magnetic Resonance Data Bank (red) overlaid onto an aqueous whole-plant extract from Arabidopsis thaliana (blue) [161].

References

    1. Ciborowski M., Lipska A., Godzien J., Ferrarini A., Korsak J., Radziwon P., Tomasiak M., Barbas C. Combination of LC-MS-and GC-MS-based Metabolomics to Study the Effect of Ozonated Autohemotherapy on Human Blood. J. Proteome Res. 2012;11:6231–6241. doi: 10.1021/pr3008946. - DOI - PubMed
    1. Liu M.-L., Zheng P., Liu Z., Xu Y., Mu J., Guo J., Huang T., Meng H.-Q., Xie P. GC-MS based metabolomics identification of possible novel biomarkers for schizophrenia in peripheral blood mononuclear cells. Mol. Biosyst. 2014;10:2398–2406. doi: 10.1039/C4MB00157E. - DOI - PubMed
    1. Raji M., Amad M., Emwas A.H. Dehydrodimerization of pterostilbene during electrospray ionization mass spectrometry. Rapid Commun. Mass Spectrom. 2013;27:1260–1266. doi: 10.1002/rcm.6571. - DOI - PubMed
    1. Guo J., Zhang M., Elmore C.S., Vishwanathan K. An integrated strategy for in vivo metabolite profiling using high-resolution mass spectrometry based data processing techniques. Anal. Chim. Acta. 2013;780:55–64. doi: 10.1016/j.aca.2013.04.012. - DOI - PubMed
    1. Huang Y., Tian Y., Li G., Li Y., Yin X., Peng C., Xu F., Zhang Z. Discovery of safety biomarkers for realgar in rat urine using UFLC-IT-TOF/MS and H-1 NMR based metabolomics. Anal. Bioanal. Chem. 2013;405:4811–4822. doi: 10.1007/s00216-013-6842-0. - DOI - PubMed

LinkOut - more resources