

Cardiomyocyte-myofibroblast contact dynamism is modulated by connexin-43
- PMID: 31253057
- PMCID: PMC6704460
- DOI: 10.1096/fj.201802740RR
Cardiomyocyte-myofibroblast contact dynamism is modulated by connexin-43
Abstract
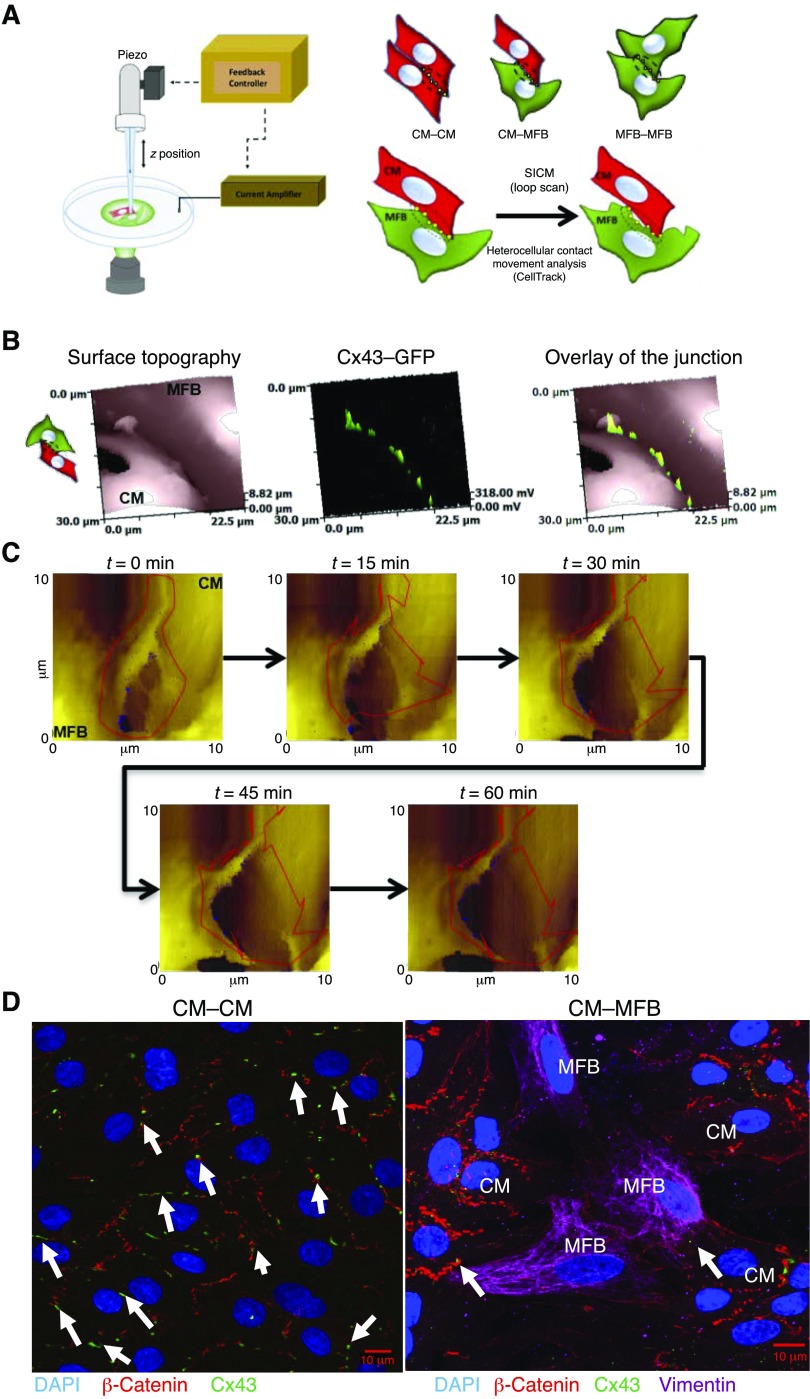
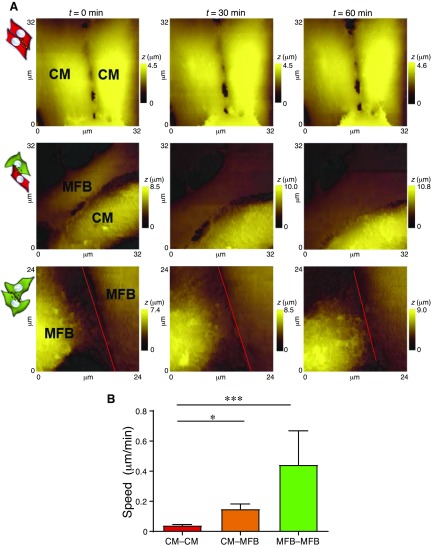
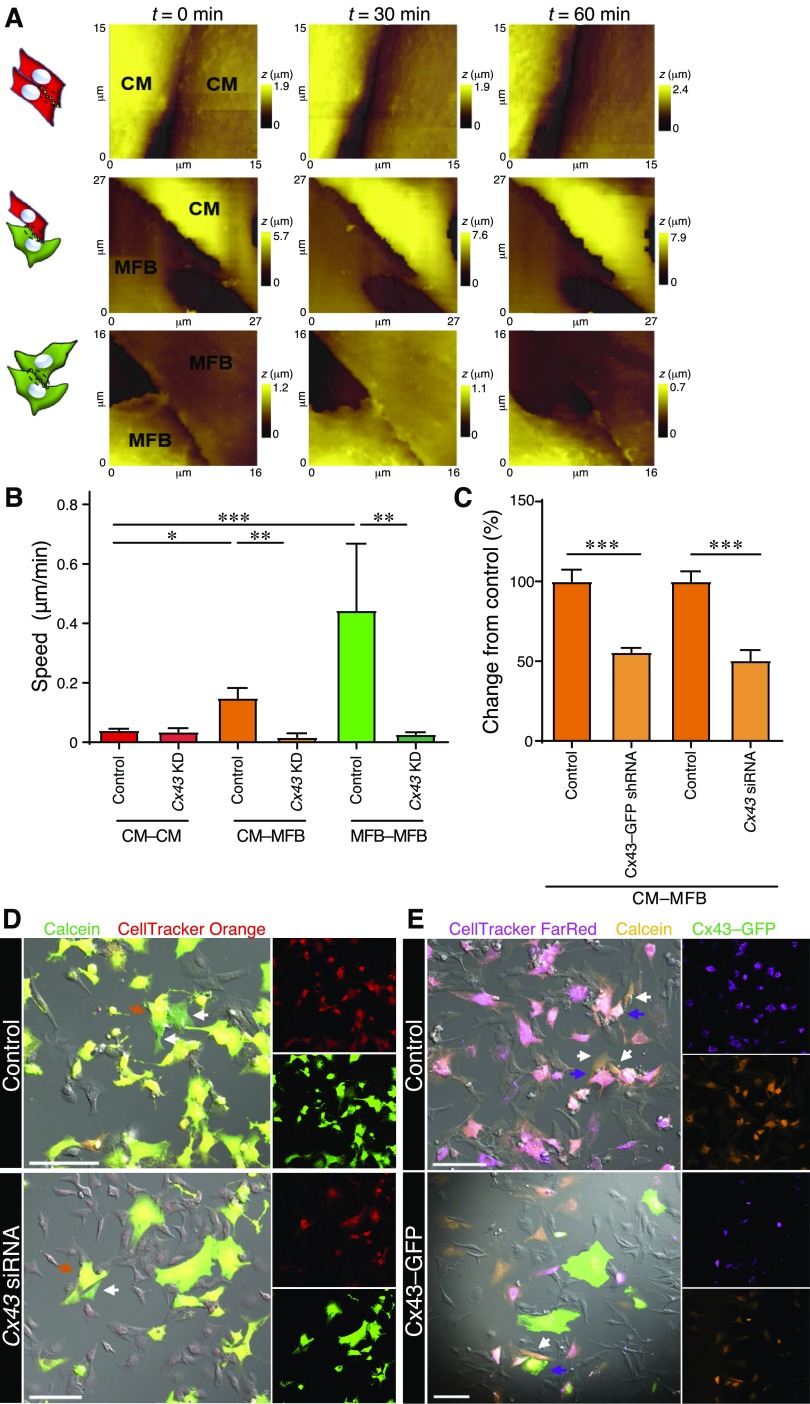
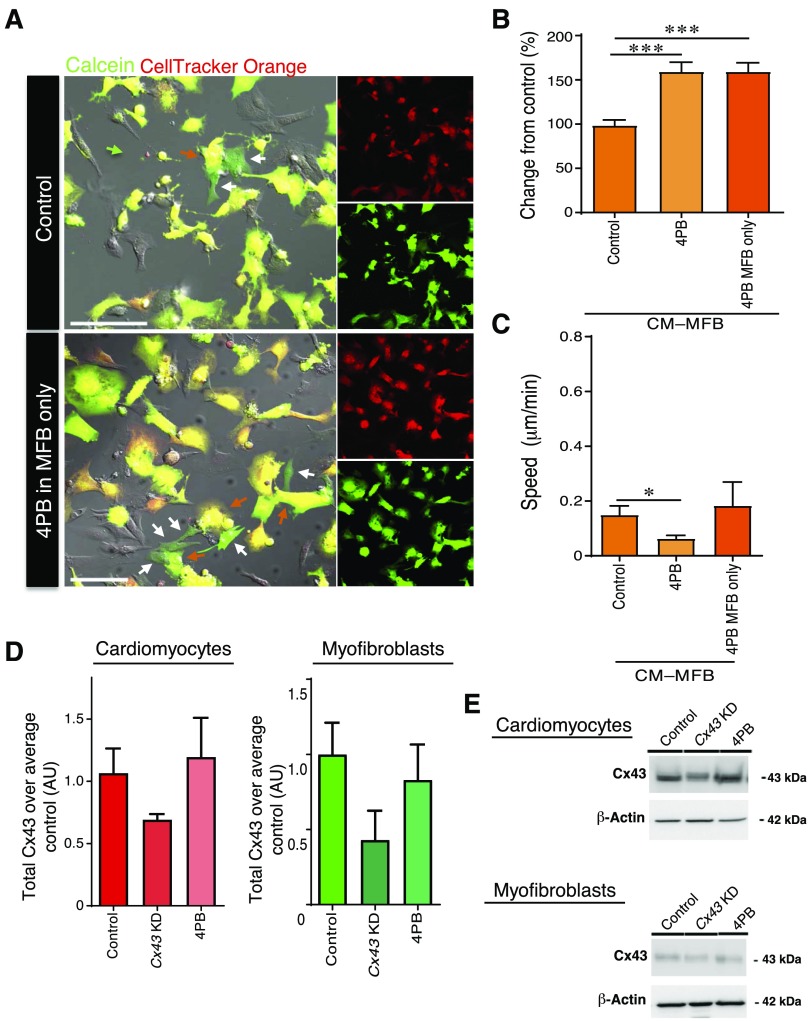
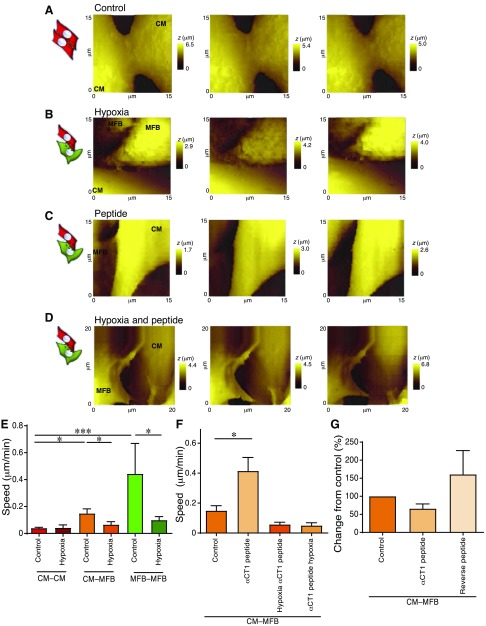
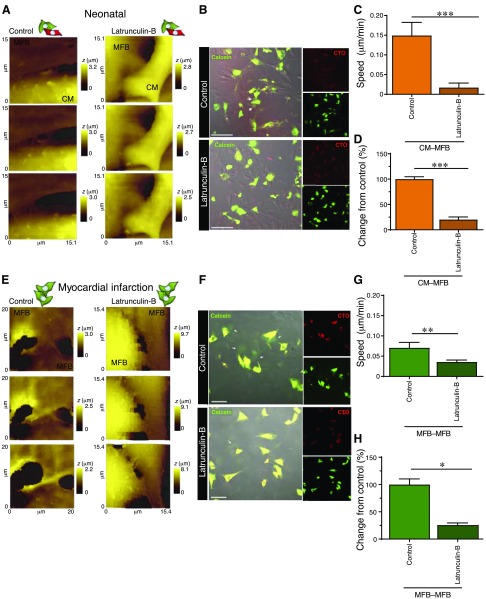
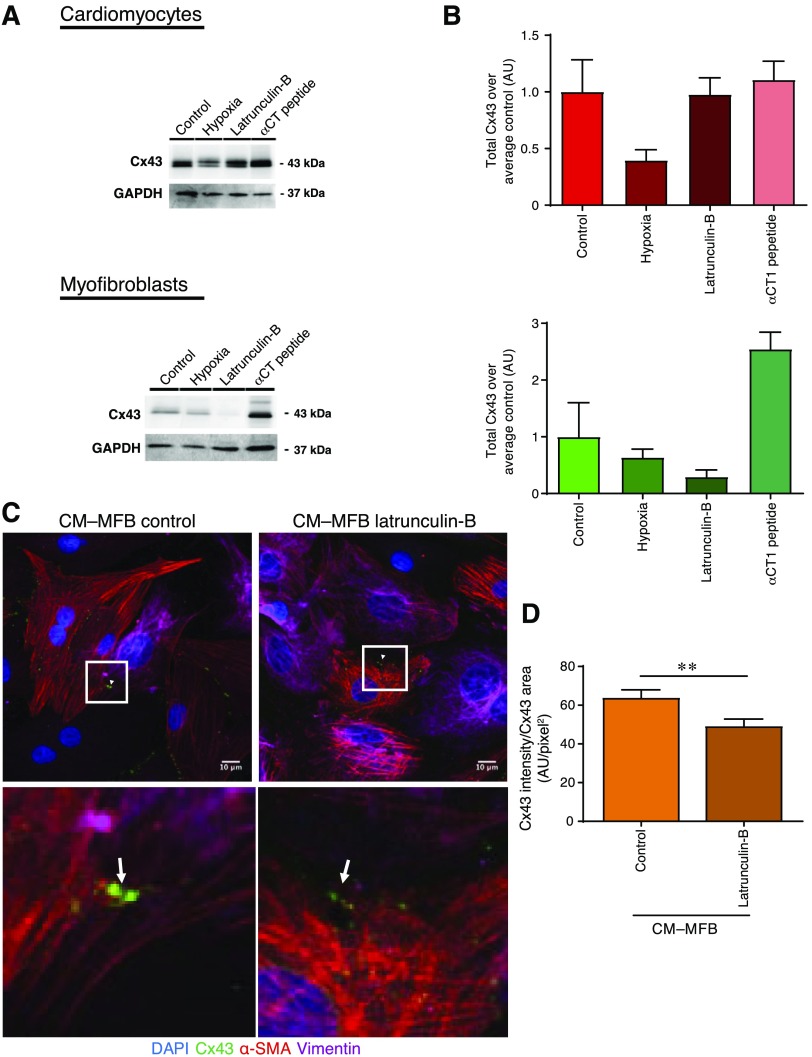
Healthy cardiomyocytes are electrically coupled at the intercalated discs by gap junctions. In infarcted hearts, adverse gap-junctional remodeling occurs in the border zone, where cardiomyocytes are chemically and electrically influenced by myofibroblasts. The physical movement of these contacts remains unquantified. Using scanning ion conductance microscopy, we show that intercellular contacts between cardiomyocytes and myofibroblasts are highly dynamic, mainly owing to the edge dynamics (lamellipodia) of the myofibroblasts. Decreasing the amount of functional connexin-43 (Cx43) at the membrane through Cx43 silencing, suppression of Cx43 trafficking, or hypoxia-induced Cx43 internalization attenuates heterocellular contact dynamism. However, we found decreased dynamism and stabilized membrane contacts when cellular coupling was strengthened using 4-phenylbutyrate (4PB). Fluorescent-dye transfer between cells showed that the extent of functional coupling between the 2 cell types correlated with contact dynamism. Intercellular calcein transfer from myofibroblasts to cardiomyocytes is reduced after myofibroblast-specific Cx43 down-regulation. Conversely, 4PB-treated myofibroblasts increased their functional coupling to cardiomyocytes. Consistent with lamellipodia-mediated contacts, latrunculin-B decreases dynamism, lowers physical communication between heterocellular pairs, and reduces Cx43 intensity in contact regions. Our data show that heterocellular cardiomyocyte-myofibroblast contacts exhibit high dynamism. Therefore, Cx43 is a potential target for prevention of aberrant cardiomyocyte coupling and myofibroblast proliferation in the infarct border zone.-Schultz, F., Swiatlowska, P., Alvarez-Laviada, A., Sanchez-Alonso, J. L., Song, Q., de Vries, A. A. F., Pijnappels, D. A., Ongstad, E., Braga, V. M. M., Entcheva, E., Gourdie, R. G., Miragoli, M., Gorelik, J. Cardiomyocyte-myofibroblast contact dynamism is modulated by connexin-43.
Keywords: Cx43; heart failure; heterocellular coupling; myocardial infarction.
Conflict of interest statement
The authors thank P. O’Gara (Imperial College London, London, United Kingdom) for the assistance with the isolation of adult rat ventricular fibroblasts and M. Sikkel (Imperial College London, London) and C. Mansfield (Imperial College London, London) for generating rat models of myocardial infarction. This work was supported by British Heart Foundation (RG/17/13/33173 to J.G.), Medical Research Council (MR/L006855/1 to J.G.), National Heart, Lung, and Blood Institute (NHLBI), U.S. National Institutes of Health Grant-1R01HL141855-01 (to R.G., J.G. and A.A.-L.), Heart Research UK, and by Italian Ministry of Education, Universities and Research (FFABR-MIUR-2017 to M.M.). M.M. and J.G. jointly supervised this work. The authors declare no conflicts of interest.
Figures

Similar articles
-
Electrical coupling between ventricular myocytes and myofibroblasts in the infarcted mouse heart.Cardiovasc Res. 2018 Mar 1;114(3):389-400. doi: 10.1093/cvr/cvx163. Cardiovasc Res. 2018. PMID: 29016731 Free PMC article.
-
Myofibroblasts cause heterogeneous Cx43 reduction and are unlikely to be coupled to myocytes in the healing canine infarct.Am J Physiol Heart Circ Physiol. 2012 Feb 1;302(3):H790-800. doi: 10.1152/ajpheart.00498.2011. Epub 2011 Nov 18. Am J Physiol Heart Circ Physiol. 2012. PMID: 22101526 Free PMC article.
-
Abolishing myofibroblast arrhythmogeneicity by pharmacological ablation of α-smooth muscle actin containing stress fibers.Circ Res. 2011 Oct 28;109(10):1120-31. doi: 10.1161/CIRCRESAHA.111.244798. Epub 2011 Sep 15. Circ Res. 2011. PMID: 21921266
-
[Remodeling of cardiac gap junctions and arrhythmias].Sheng Li Xue Bao. 2011 Dec 25;63(6):586-92. Sheng Li Xue Bao. 2011. PMID: 22193455 Review. Chinese.
-
Trafficking highways to the intercalated disc: new insights unlocking the specificity of connexin 43 localization.Cell Commun Adhes. 2014 Feb;21(1):43-54. doi: 10.3109/15419061.2013.876014. Cell Commun Adhes. 2014. PMID: 24460200 Free PMC article. Review.
Cited by
-
Scanning Ion Conductance Microscopy.Chem Rev. 2021 Oct 13;121(19):11726-11768. doi: 10.1021/acs.chemrev.0c00962. Epub 2020 Dec 9. Chem Rev. 2021. PMID: 33295182 Free PMC article. Review.
-
Pericellular oxygen dynamics in human cardiac fibroblasts and iPSC-cardiomyocytes in high-throughput plates: insights from experiments and modeling.J Mol Cell Cardiol Plus. 2025 Jun 11;13:100464. doi: 10.1016/j.jmccpl.2025.100464. eCollection 2025 Sep. J Mol Cell Cardiol Plus. 2025. PMID: 40600000 Free PMC article.
-
Src-homology domain 2 containing protein tyrosine phosphatase-1 (SHP-1) directly binds to proto-oncogene tyrosine-protein kinase Src (c-Src) and promotes the transcriptional activation of connexin 43 (Cx43).Bioengineered. 2022 May;13(5):13534-13543. doi: 10.1080/21655979.2022.2079252. Bioengineered. 2022. PMID: 35659197 Free PMC article.
-
Fibroblast contributions to ischemic cardiac remodeling.Cell Signal. 2021 Jan;77:109824. doi: 10.1016/j.cellsig.2020.109824. Epub 2020 Nov 2. Cell Signal. 2021. PMID: 33144186 Free PMC article. Review.
-
Opto-SICM framework combines optogenetics with scanning ion conductance microscopy for probing cell-to-cell contacts.Commun Biol. 2023 Nov 8;6(1):1131. doi: 10.1038/s42003-023-05509-3. Commun Biol. 2023. PMID: 37938652 Free PMC article.
References
-
- Haefliger J. A., Nicod P., Meda P. (2004) Contribution of connexins to the function of the vascular wall. Cardiovasc. Res. 62, 345–356 - PubMed
Publication types
MeSH terms
Substances
Grants and funding
LinkOut - more resources
Full Text Sources
Miscellaneous
