. 2019 Jun 28;20(1):20.
doi: 10.1186/s12860-019-0199-y.

Single cell RNA-Seq reveals pre-cDCs fate determined by transcription factor combinatorial dose

Affiliations

Single cell RNA-Seq reveals pre-cDCs fate determined by transcription factor combinatorial dose

Wenji Ma et al. BMC Mol Cell Biol. .

Abstract

Background: Classic dendritic cells (cDCs) play a central role in the immune system by processing and presenting antigens to activate T cells, and consist of two major subsets: CD141+ cDC (cDC1) and CD1c+ cDC (cDC2). A population of migratory precursor cells, the pre-cDCs, is the immediate precursors to both cDC subsets. Previous studies showed that there were two pre-committed pre-cDC subpopulations. However, the key molecular drivers of pre-commitment in human pre-cDCs were not investigated.

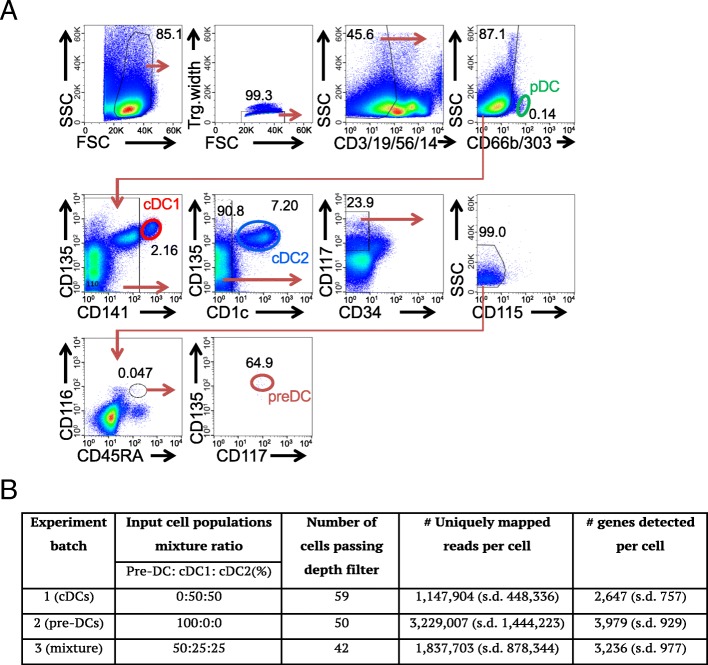
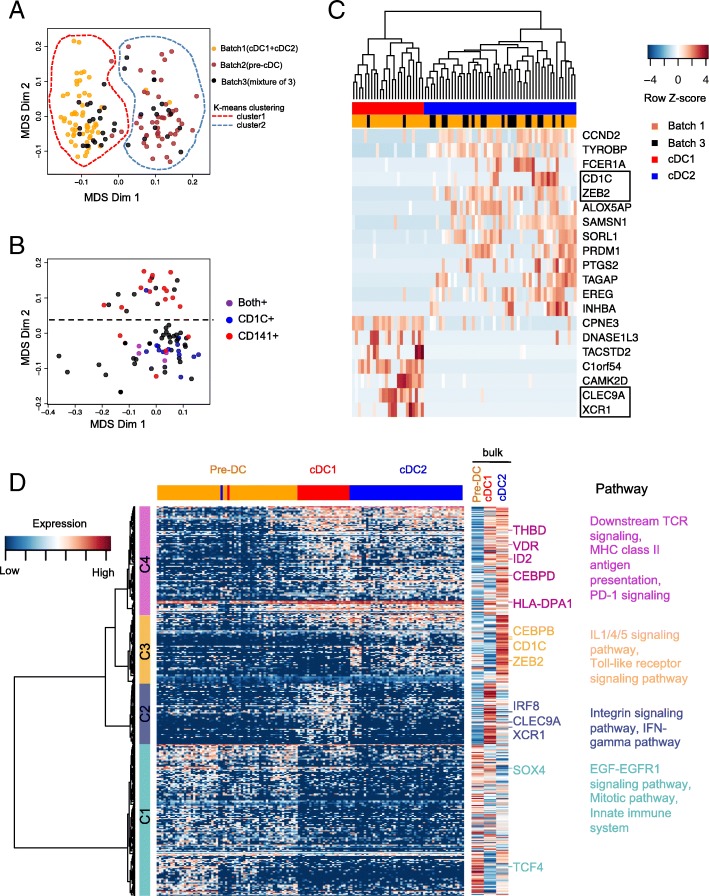
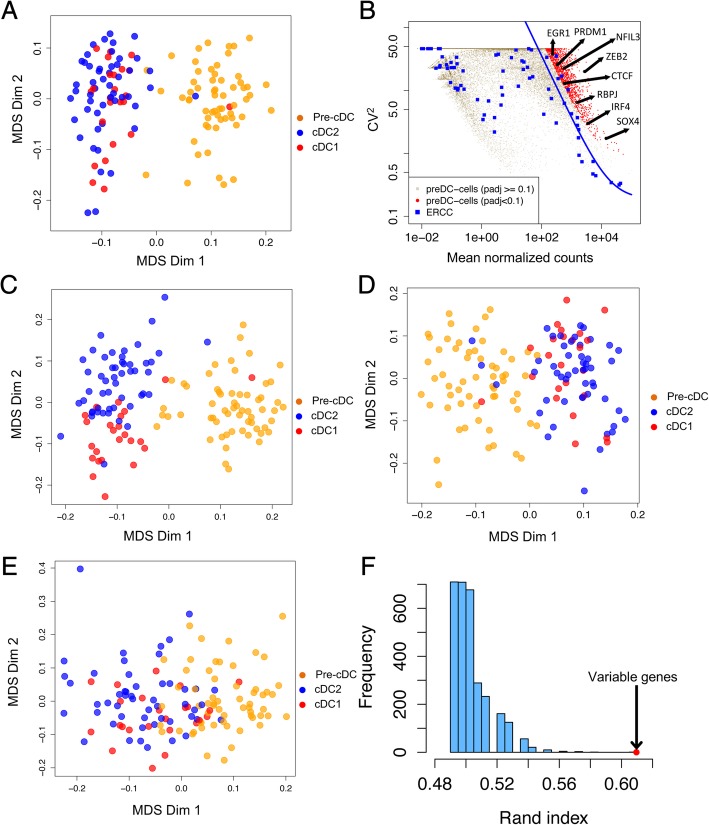
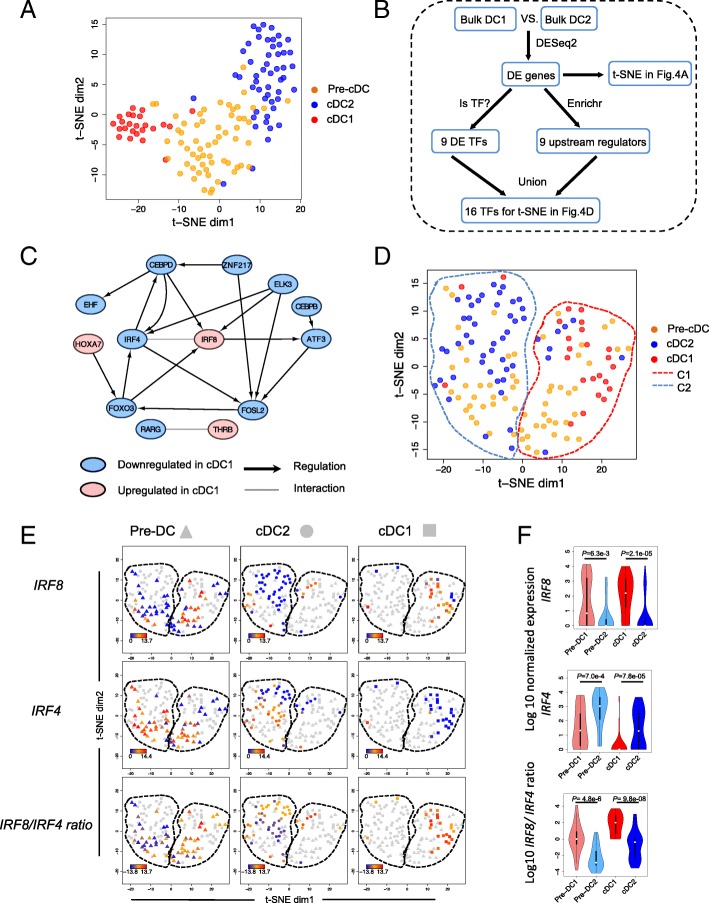
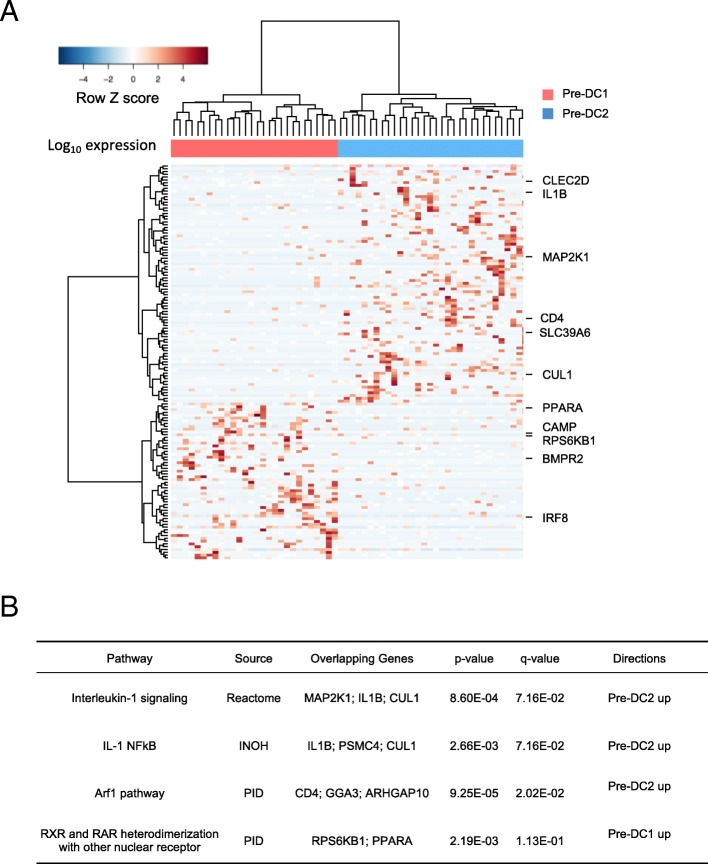
Results: To identify the key molecular drivers for pre-commitment in human pre-cDCs, we performed single cell RNA sequencing (RNA-Seq) of two cDC subsets and pre-cDCs, and bulk RNA-Seq of pre-cDCs and cDCs from human peripheral blood. We found that pre-DC subpopulations cannot be separated by either variable genes within pre-cDCs or differentially expressed genes between cDC1 and cDC2. In contrast, they were separated by 16 transcription factors that are themselves differentially expressed or have regulated targets enriched in the differentially expressed genes between bulk cDC1 and cDC2, with one subpopulation close to cDC1 and the other close to cDC2. More importantly, these two pre-cDC sub-populations are correlated with ratio of IRF8 to IRF4 expression level more than their individual expression level. We also verified these findings using three recently published datasets.

Conclusions: In this study, we demonstrate that single cell transcriptome profiling can reveal pre-cDCs differentiation map, and our results suggest the concept that combinatorial dose of transcription factors determines cell differentiation fate.

Keywords: Cell differentiation; Dendritic cell; Single cell RNA-Seq; Transcriptional factor.


Conflict of interest statement

The authors declare that they have no competing interests.

Figures

Fig. 1
Fig. 1
Experiment design and sample summary. a Gating strategy for isolating pre-cDCs and cDC1s and cDC2s. b Sequencing batch experiments details
Fig. 2
Fig. 2
Cell type identification of the single cells from mixture with MDS based on global transcriptome. a Multidimensional scaling (MDS) plot for the cells that passed quality control, batch1 (yellow, cDCs), batch2 (brown, pre-cDCs) and batch3 (black, mixture of cDCs and pre-cDCs), where the input distance was adjusted for dropout rate with SCDE. The cells can be separated into 2 clusters by k-means clustering: cluster1 for cDCs and cluster 2 for pre-cDCs. b The clustering pattern of cluster1 identified in panel a with MDS. Each cell is colored with binary expression of CD141(red), CD1c (blue), both (purple) or none (black). c Heatmap of the top 20 differentially expressed genes derived by SCDE by comparing the upper and lower groups of cDCs in panel b. The top dendrogram was generated with hierarchical clustering. The two column color bars represent batch and cell type information, respectively. Genes surround by black box are known key genes for cDC differentiation. d Transcriptional signature of pre-cDC, cDC1 and cDC2 population. Three hundred eighty genes shown in rows were differentially expressed in at least two populations of pre-cDC, cDC1 and cDC2 computed with ANOVA (false-discovery rate (FDR) < 0.05) and can be classified into 4 clusters(C1–4) indicated by the row slide color. Bulk expression of the three cell types for these genes after averaging over 3 biological replicates is also shown on the right. Right margin also shows the predicted upstream regulators and enriched pathways for each gene cluster. Single cells in the columns were ordered by the hierarchical clustering result based on the 380 genes
Fig. 3
Fig. 3
Highly variable genes in pre-cDCs population can separate DC subsets. a MDS plot of all the single cells based on global transcriptome. b Squared coefficient of variation (CV2) was plotted against the mean of normalized read counts for each gene of 50 pre-cDCs in Batch 2. The solid blue curve denotes the fitted variance-mean dependence with ERCC spike-ins. The genes marked in red show higher expression variability than background/technical noise (measured with spike-ins, blue) by testing the null hypothesis that the coefficient of biological variation is less than 50% with FDR < 0.1. c MDS plot of all the single cells with the 842 biologically variable genes. d MDS plot of all the single cells with randomly 842 sampled genes without replacement from genes that have mean expression > 100 in panel A. e MDS plot of all the single cells with 496 cell cycle genes downloaded from Reactome (http://www.reactome.org). f Histogram of rand index between the clustering result based on 842 sampled genes and the inferred cDC identities in Fig. 2. Larger rand index indicates higher consistence between two clustering results. Genes of high expression were randomly selected for 3000 rounds. The red dot indicates the rand index between the DC clusters based on the 842 variable genes and the inferred cDC identities
Fig. 4
Fig. 4
Pre-cDC subpopulation pattern in human is implicated by differentially expressed TFs between cDC1 and cDC2. a t-SNE plot of all the single cells with the full set of differentially expressed genes between bulk cDC1 and cDC2. b Flowchart of how to identify the MR TFs. c Regulatory network of the 13 out of 16 MR TFs based on the database of transcription factor and target relationship in human hematopoietic lineages from Neph et al. [25] complemented by String database [26]. d t-SNE plot of all the single cells with MR TFs that are differentially expressed between bulk cDC1 and cDC2. The cells were clustered into two groups C1 and C2 by k-means clustering. e Expression level of IRF8, IRF4 and IRF8/IRF4 expression ratio for each single cell. The three rows represent IRF8, IRF4 and IRF8/IRF4, respectively. The columns represent pre-cDC, cDC2 and cDC1, respectively. For example, the IRF8 expression level from low to high in pre-cDCs is represented from blue, orange to red, and the other cDC single cells are colored in gray. f Violin plot of IRF8 expression, IRF4 expression and IRF8/IRF4 expression ratio in single cell populations: pre-cDC1, pre-cDC2, cDC1 and cDC2. P values indicated between pre-DC1 and pre-DC2 and between cDC1 and cDC2 are from Wilcoxon Rank Sum test
Fig. 5
Fig. 5
Characterization of the pre-cDC subpopulations. a Heatmap showing genes that are differentially expressed between the two subpopulations of pre-cDCs. b Enriched pathways with genes upregulated in each pre-cDC subset

Similar articles

Cited by

References

    1. Schlitzer A, McGovern N, Ginhoux F. Dendritic cells and monocyte-derived cells: Two complementary and integrated functional systems. inSeminars in cell & developmental biology. 2015;41:9–22. - PubMed
    1. Bachem A, et al. Superior antigen cross-presentation and XCR1 expression define human CD11c+CD141+ cells as homologues of mouse CD8+ dendritic cells. J Exp Med. 2010;207(6):1273–1281. - PMC - PubMed
    1. Schlitzer A, Ginhoux F. Organization of the mouse and human DC network. Curr Opin Immunol. 2014;26:90–99. - PubMed
    1. Breton G, et al. Circulating precursors of human CD1c+ and CD141+ dendritic cells. J Exp Med. 2015;212(3):401–413. - PMC - PubMed
    1. Breton G, et al. Human dendritic cells (DCs) are derived from distinct circulating precursors that are precommitted to become CD1c+ or CD141+ DCs. J Exp Med. 2016;213(13):2861–2870. - PMC - PubMed

Publication types

MeSH terms