

Ethylene-mediated improvement in sucrose accumulation in ripening sugarcane involves increased sink strength
- PMID: 31253103
- PMCID: PMC6599285
- DOI: 10.1186/s12870-019-1882-z
Ethylene-mediated improvement in sucrose accumulation in ripening sugarcane involves increased sink strength
Abstract
Background: Sugarcane is a major crop producing about 80% of sugar globally. Increasing sugar content is a top priority for sugarcane breeding programs worldwide, however, the progress is extremely slow. Owing to its commercial significance, the physiology of sucrose accumulation has been studied extensively but it did not lead to any significant practical outcomes. Recent molecular studies are beginning to recognize genes and gene networks associated with this phenomenon. To further advance our molecular understanding of sucrose accumulation, we altered sucrose content of sugarcane genotypes with inherently large variation for sucrose accumulation using a sugarcane ripener, ethylene, and studied their transcriptomes to identify genes associated with the phenomenon.
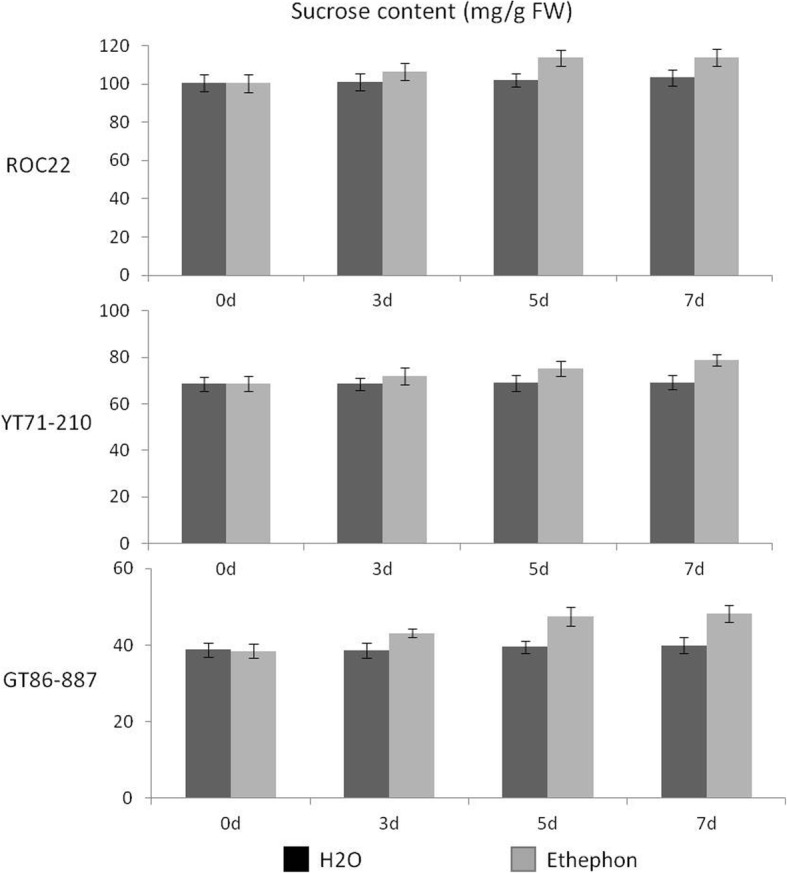
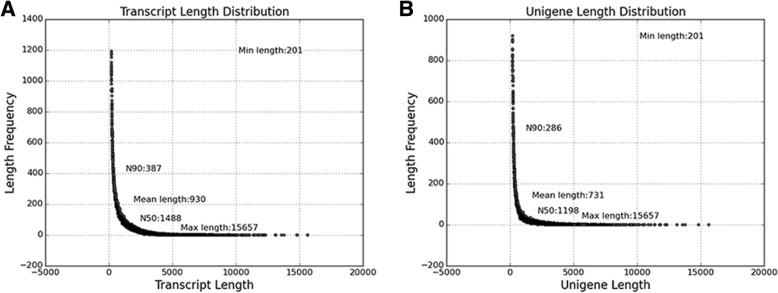
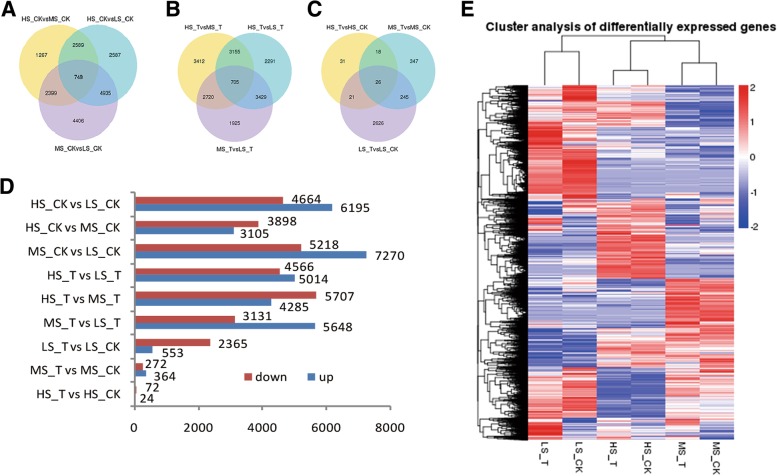
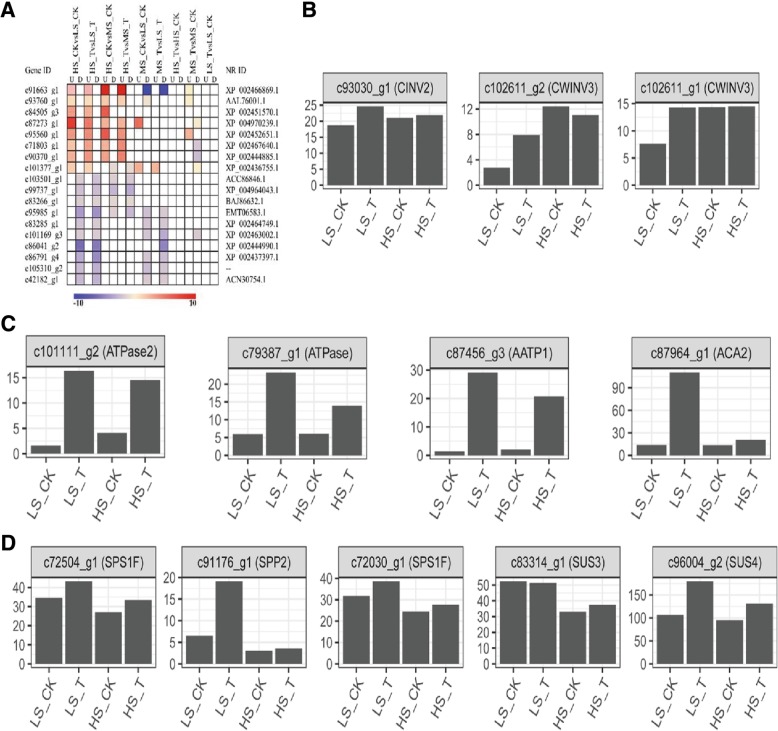
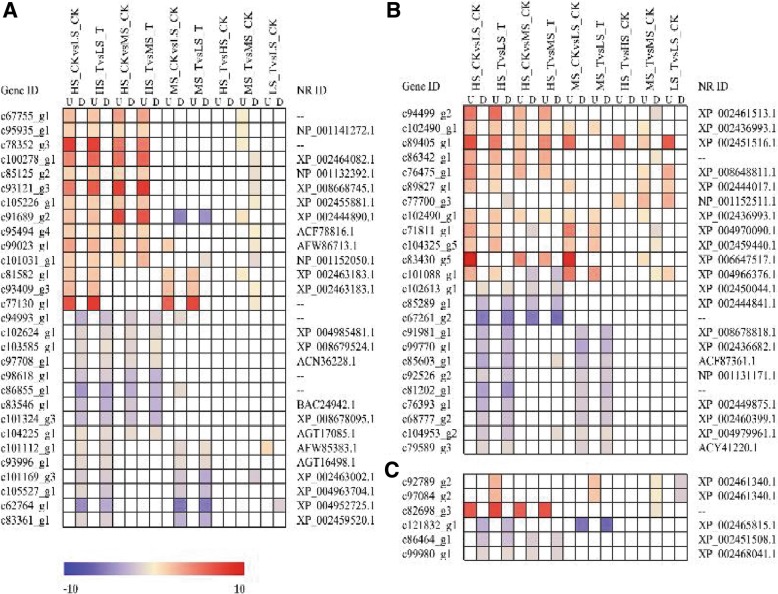
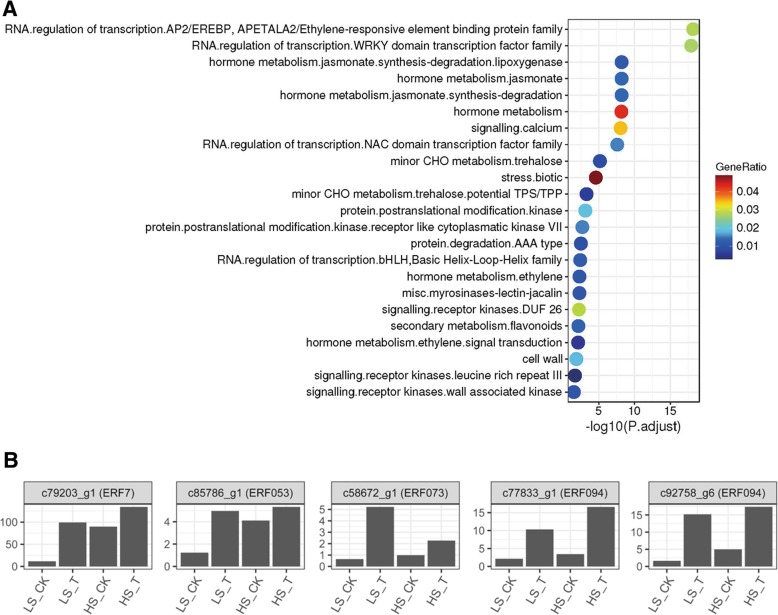
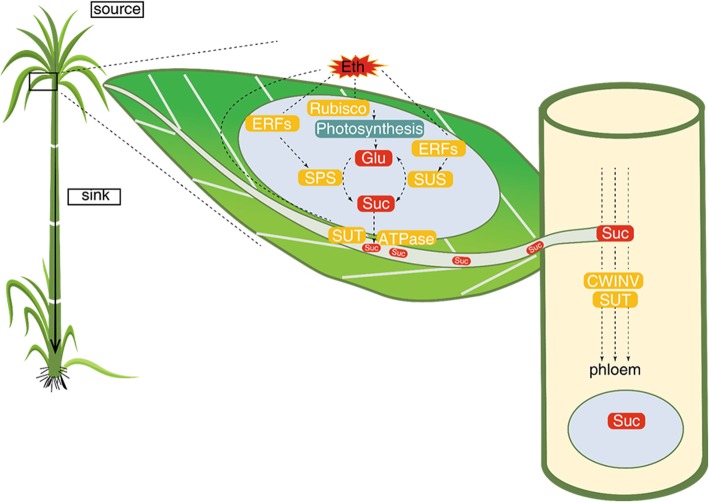
Results: Sucrose content variation in the experimental genotypes was substantial, with the top-performing clone producing almost 60% more sucrose than the poorest performer. Ethylene treatment increased stem sucrose content but that occurred only in low-sugar genotype. Transcriptomic analyses have identified about 160,000 unigenes of which 86,000 annotated genes were classified into functional groups associated with carbohydrate metabolism, signaling, localization, transport, hydrolysis, growth, catalytic activity, membrane and storage, suggesting the structural and functional specification, including sucrose accumulation, occurring in maturing internodes. About 25,000 genes were differentially expressed between all genotypes and treatments combined. Genotype had a dominant effect on differential gene expression than ethylene treatment. Sucrose and starch metabolism genes were more responsive to ethylene treatment in low-sugar genotype. Ethylene caused differential gene expression of many stress-related transcription factors, carbohydrate metabolism, hormone metabolism and epigenetic modification. Ethylene-induced expression of ethylene-responsive transcription factors, cytosolic acid- and cell wall-bound invertases, and ATPase was more pronounced in low- than in high-sugar genotype, suggesting an ethylene-stimulated sink activity and consequent increased sucrose accumulation in low-sugar genotype.
Conclusion: Ethylene-induced sucrose accumulation is more pronounced in low-sugar sugarcane genotype, and this is possibly achieved by the preferential activation of genes such as invertases that increase sink strength in the stem. The relatively high enrichment of differentially expressed genes associated with hormone metabolism and signaling and stress suggests a strong hormonal regulation of source-sink activity, growth and sucrose accumulation in sugarcane.
Keywords: Ethylene; Sucrose accumulation; Sugarcane; Transcriptomics.
Conflict of interest statement
The authors declare that they have no competing interests.
Figures
Similar articles
-
Association of variation in the sugarcane transcriptome with sugar content.BMC Genomics. 2017 Nov 25;18(1):909. doi: 10.1186/s12864-017-4302-5. BMC Genomics. 2017. PMID: 29178834 Free PMC article.
-
Ethylene-induced transcriptional and hormonal responses at the onset of sugarcane ripening.Sci Rep. 2017 Mar 7;7:43364. doi: 10.1038/srep43364. Sci Rep. 2017. PMID: 28266527 Free PMC article.
-
Expression analysis of genes associated with sucrose accumulation in sugarcane (Saccharum spp. hybrids) varieties differing in content and time of peak sucrose storage.Plant Biol (Stuttg). 2015 May;17(3):608-17. doi: 10.1111/plb.12276. Epub 2015 Jan 2. Plant Biol (Stuttg). 2015. PMID: 25311688
-
Sugarcane for bioenergy production: an assessment of yield and regulation of sucrose content.Plant Biotechnol J. 2010 Apr;8(3):263-76. doi: 10.1111/j.1467-7652.2009.00491.x. Plant Biotechnol J. 2010. PMID: 20388126 Review.
-
Regulation of ethylene-induced transcription of defense genes.Plant Cell Physiol. 2000 Nov;41(11):1187-92. doi: 10.1093/pcp/pcd057. Plant Cell Physiol. 2000. PMID: 11092902 Review.
Cited by
-
Proteomics data analysis using multiple statistical approaches identified proteins and metabolic networks associated with sucrose accumulation in sugarcane.BMC Genomics. 2022 Jul 22;23(1):532. doi: 10.1186/s12864-022-08768-2. BMC Genomics. 2022. PMID: 35869434 Free PMC article.
-
Industrial chicory genome gives insights into the molecular timetable of anther development and male sterility.Front Plant Sci. 2023 Jun 13;14:1181529. doi: 10.3389/fpls.2023.1181529. eCollection 2023. Front Plant Sci. 2023. PMID: 37384353 Free PMC article.
-
A transcriptomic analysis of sugarcane response to Leifsonia xyli subsp. xyli infection.PLoS One. 2021 Feb 2;16(2):e0245613. doi: 10.1371/journal.pone.0245613. eCollection 2021. PLoS One. 2021. PMID: 33529190 Free PMC article.
-
Applying Molecular Phenotyping Tools to Explore Sugarcane Carbon Potential.Front Plant Sci. 2021 Feb 19;12:637166. doi: 10.3389/fpls.2021.637166. eCollection 2021. Front Plant Sci. 2021. PMID: 33679852 Free PMC article. Review.
-
Novel transcriptome networks are associated with adaptation of capsicum fruit development to a light-blocking glasshouse film.Front Plant Sci. 2023 Nov 6;14:1280314. doi: 10.3389/fpls.2023.1280314. eCollection 2023. Front Plant Sci. 2023. PMID: 38023880 Free PMC article.
References
-
- FAOSTAT (2018) Crops. http://www.fao.org/faostat/en/#data/QC
-
- Moore P. Temporal and spatial regulation of sucrose accumulation in the sugarcane stem. Funct Plant Biol. 1995;22(4):661–679.
-
- Waclawovsky AJ, Sato PM, Lembke CG, Moore PH, Souza GM. Sugarcane for bioenergy production: an assessment of yield and regulation of sucrose content. Plant Biotechnol J. 2010;8(3):263–276. - PubMed
-
- Dwight T, Lakshmanan P, Songstad D. Biofuels: global impact on renewable energy, production agriculture, and technological advancements (M) 2011.
-
- Jackson PA. Breeding for improved sugar content in sugarcane. Field Crop Res. 2005;92(2–3):277–290.
MeSH terms
Substances
LinkOut - more resources
Full Text Sources
Molecular Biology Databases
