

Functional diversity of inhibitors tackling the differentiation blockage of MLL-rearranged leukemia
- PMID: 31253180
- PMCID: PMC6599250
- DOI: 10.1186/s13045-019-0749-y
Functional diversity of inhibitors tackling the differentiation blockage of MLL-rearranged leukemia
Abstract
Introduction: The chromosomal rearrangements of the mixed-lineage leukemia gene MLL (KMT2A) have been extensively characterized as a potent oncogenic driver in leukemia. For its oncogenic function, most MLL-fusion proteins exploit the multienzyme super elongation complex leading to elevated expression of MLL target genes. High expression of MLL target genes overwrites the normal hematopoietic differentiation program, resulting in undifferentiated blasts characterized by the capacity to self-renew. Although extensive resources devoted to increased understanding of therapeutic targets to overcome de-differentiation in ALL/AML, the inter-dependencies of targets are still not well described. The majority of inhibitors potentially interfering with MLL-fusion protein driven transformation have been characterized in individual studies, which so far hindered their direct cross-comparison.
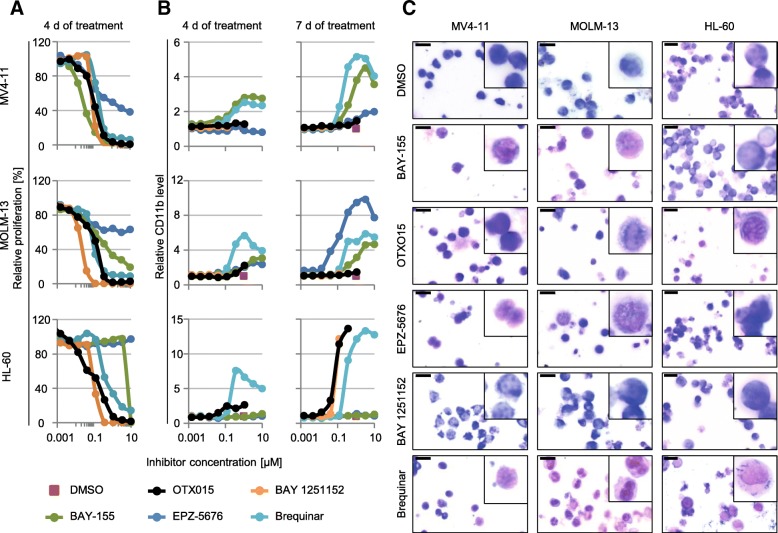
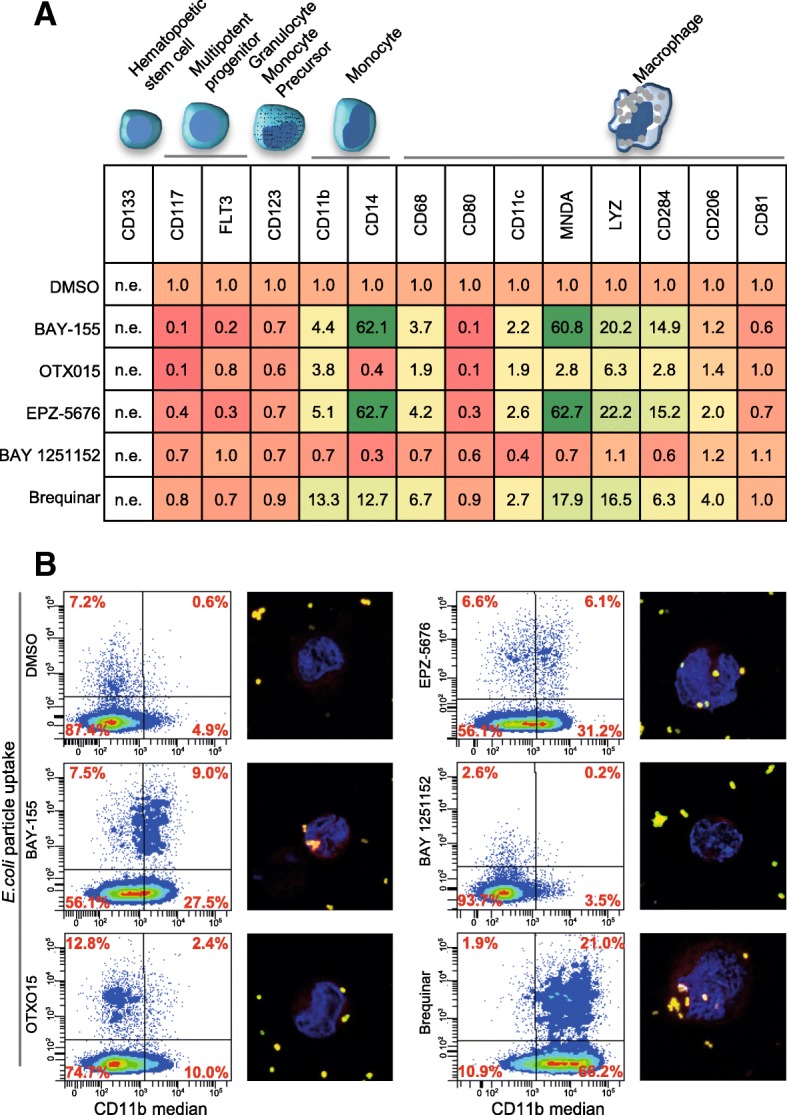
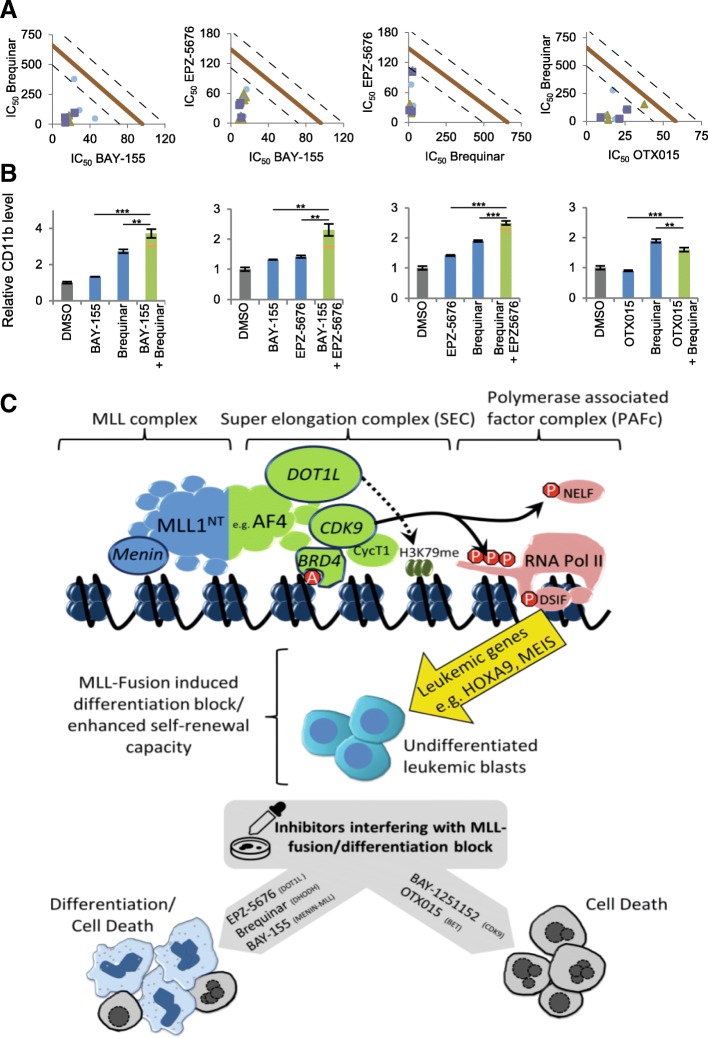
Methods: In our study, we characterized head-to-head clinical stage inhibitors for BET, DHODH, DOT1L as well as two novel inhibitors for CDK9 and the Menin-MLL interaction with a focus on differentiation induction. We profiled those inhibitors for global gene expression effects in a large cell line panel and examined cellular responses such as inhibition of proliferation, apoptosis induction, cell cycle arrest, surface marker expression, morphological phenotype changes, and phagocytosis as functional differentiation readout. We also verified the combination potential of those inhibitors on proliferation and differentiation level.
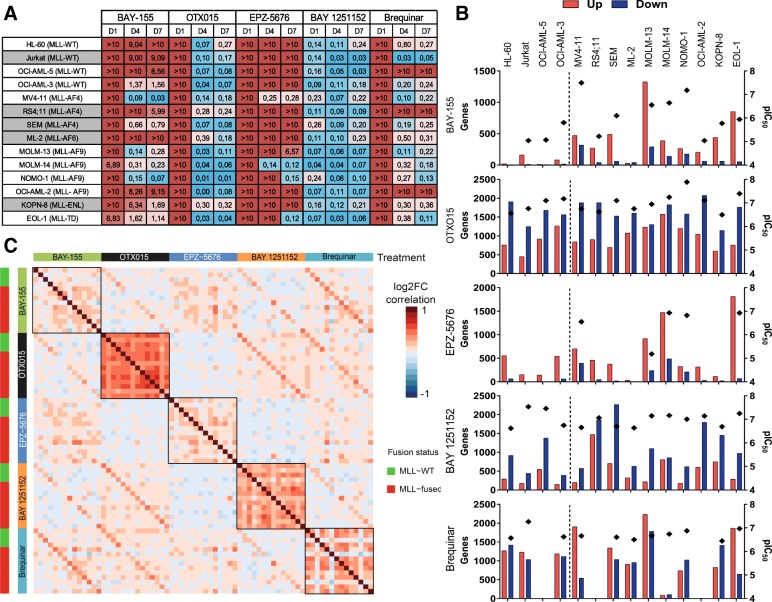
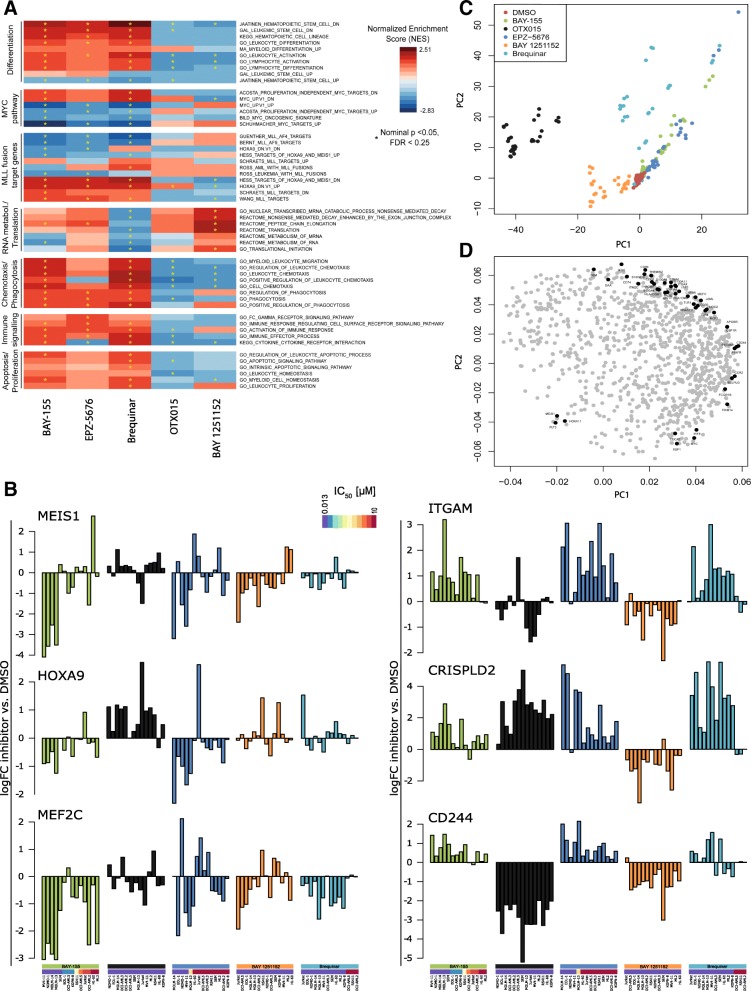
Results: Our analysis revealed significant differences in differentiation induction and in modulating MLL-fusion target gene expression. We observed Menin-MLL and DOT1L inhibitors act very specifically on MLL-fused leukemia cell lines, whereas inhibitors of BET, DHODH and P-TEFb have strong effects beyond MLL-fusions. Significant differentiation effects were detected for Menin-MLL, DOT1L, and DHODH inhibitors, whereas BET and CDK9 inhibitors primarily induced apoptosis in AML/ALL cancer models. For the first time, we explored combination potential of the abovementioned inhibitors with regards to overcoming the differentiation blockage.
Conclusion: Our findings show substantial diversity in the molecular activities of those inhibitors and provide valuable insights into the further developmental potential as single agents or in combinations in MLL-fused leukemia.
Keywords: Acute lymphoblastic leukemia (ALL); Acute myeloid leukemia (AML); BET; DHODH; DOT1L; MLL-fusion; Menin-MLL; P-TEFb; Small molecule inhibitors.
Conflict of interest statement
All authors are employees of Bayer AG. C.S. is listed as inventor of a patent application (WO2017207387A1) related to Menin-MLL inhibitors.
Figures
Similar articles
-
Complementary activities of DOT1L and Menin inhibitors in MLL-rearranged leukemia.Leukemia. 2017 Jun;31(6):1269-1277. doi: 10.1038/leu.2016.327. Epub 2016 Nov 14. Leukemia. 2017. PMID: 27840424
-
Pharmacological inhibition of LSD1 for the treatment of MLL-rearranged leukemia.J Hematol Oncol. 2016 Mar 12;9:24. doi: 10.1186/s13045-016-0252-7. J Hematol Oncol. 2016. PMID: 26970896 Free PMC article.
-
Co-inhibition of HDAC and MLL-menin interaction targets MLL-rearranged acute myeloid leukemia cells via disruption of DNA damage checkpoint and DNA repair.Clin Epigenetics. 2019 Oct 7;11(1):137. doi: 10.1186/s13148-019-0723-0. Clin Epigenetics. 2019. PMID: 31590682 Free PMC article.
-
Disordered epigenetic regulation in MLL-related leukemia.Int J Hematol. 2012 Oct;96(4):428-37. doi: 10.1007/s12185-012-1180-0. Epub 2012 Sep 29. Int J Hematol. 2012. PMID: 23054645 Review.
-
A Box of Chemistry to Inhibit the MEN1 Tumor Suppressor Gene Promoting Leukemia.ChemMedChem. 2021 May 6;16(9):1391-1402. doi: 10.1002/cmdc.202000972. Epub 2021 Mar 10. ChemMedChem. 2021. PMID: 33534953 Free PMC article. Review.
Cited by
-
Targeting Menin and CD47 to Address Unmet Needs in Acute Myeloid Leukemia.Cancers (Basel). 2022 Nov 29;14(23):5906. doi: 10.3390/cancers14235906. Cancers (Basel). 2022. PMID: 36497385 Free PMC article. Review.
-
Updates in KMT2A Gene Rearrangement in Pediatric Acute Lymphoblastic Leukemia.Biomedicines. 2023 Mar 8;11(3):821. doi: 10.3390/biomedicines11030821. Biomedicines. 2023. PMID: 36979800 Free PMC article. Review.
-
Targeting the histone H3 lysine 79 methyltransferase DOT1L in MLL-rearranged leukemias.J Hematol Oncol. 2022 Mar 24;15(1):35. doi: 10.1186/s13045-022-01251-1. J Hematol Oncol. 2022. PMID: 35331314 Free PMC article. Review.
-
Targeted Epigenetic Interventions in Cancer with an Emphasis on Pediatric Malignancies.Biomolecules. 2022 Dec 28;13(1):61. doi: 10.3390/biom13010061. Biomolecules. 2022. PMID: 36671446 Free PMC article. Review.
-
Therapeutic strategies against hDOT1L as a potential drug target in MLL-rearranged leukemias.Clin Epigenetics. 2020 May 25;12(1):73. doi: 10.1186/s13148-020-00860-2. Clin Epigenetics. 2020. PMID: 32450905 Free PMC article. Review.
References
-
- Marschalek R. MLL leukemia and future treatment strategies. Archiv der Pharmazie. 2015;348(4):221–228. - PubMed
-
- Armstrong SA, Staunton JE, Silverman LB, Pieters R, den Boer ML, Minden MD, et al. MLL translocations specify a distinct gene expression profile that distinguishes a unique leukemia. Nat Genet. 2002;30(1):41–47. - PubMed
-
- Krivtsov AV, Armstrong SA. MLL translocations, histone modifications and leukaemia stem-cell development. Nat Rev Cancer. 2007;7(11):823–833. - PubMed
MeSH terms
Substances
LinkOut - more resources
Full Text Sources
Other Literature Sources
Medical
Molecular Biology Databases
Miscellaneous
