. 2019 Aug;212(4):1429-1443.
doi: 10.1534/genetics.119.302423. Epub 2019 Jun 28.

Mitochondrial Network State Scales mtDNA Genetic Dynamics

Affiliations

Mitochondrial Network State Scales mtDNA Genetic Dynamics

Juvid Aryaman et al. Genetics. 2019 Aug.

Abstract

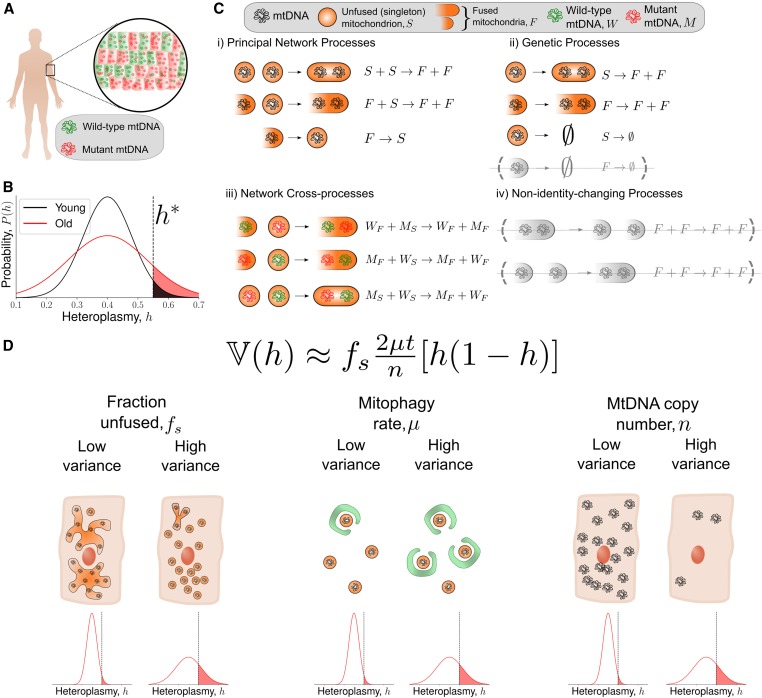
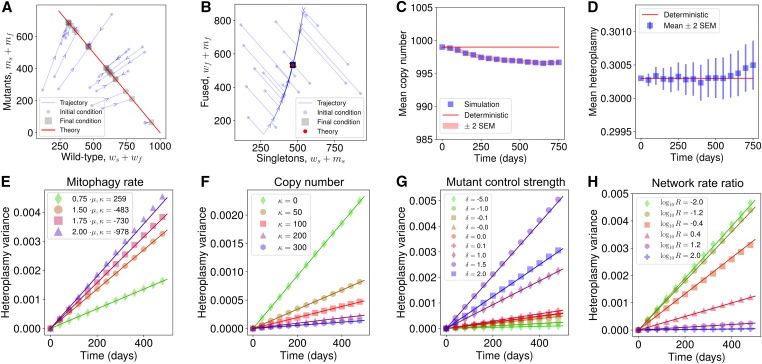
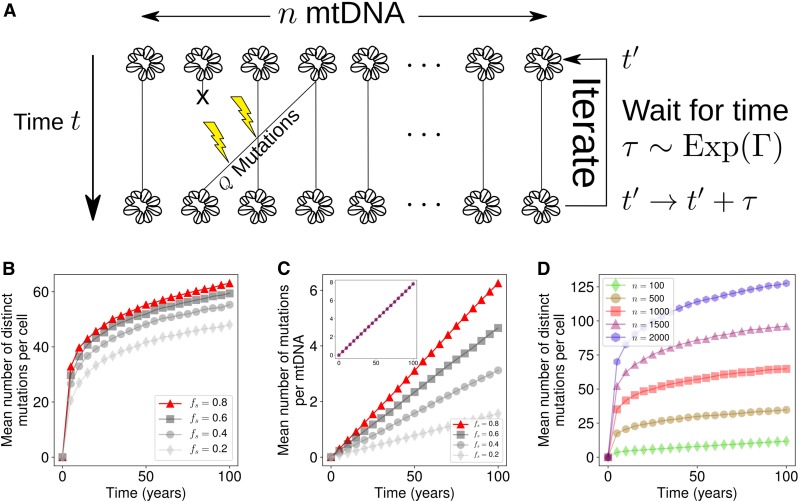
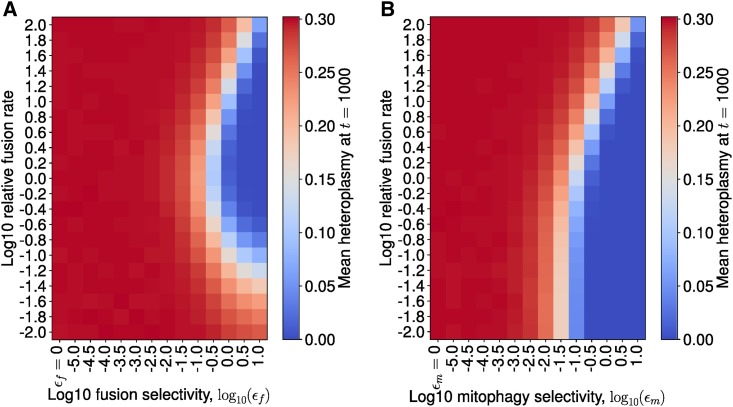
Mitochondrial DNA (mtDNA) mutations cause severe congenital diseases but may also be associated with healthy aging. mtDNA is stochastically replicated and degraded, and exists within organelles which undergo dynamic fusion and fission. The role of the resulting mitochondrial networks in the time evolution of the cellular proportion of mutated mtDNA molecules (heteroplasmy), and cell-to-cell variability in heteroplasmy (heteroplasmy variance), remains incompletely understood. Heteroplasmy variance is particularly important since it modulates the number of pathological cells in a tissue. Here, we provide the first wide-reaching theoretical framework which bridges mitochondrial network and genetic states. We show that, under a range of conditions, the (genetic) rate of increase in heteroplasmy variance and de novo mutation are proportionally modulated by the (physical) fraction of unfused mitochondria, independently of the absolute fission-fusion rate. In the context of selective fusion, we show that intermediate fusion:fission ratios are optimal for the clearance of mtDNA mutants. Our findings imply that modulating network state, mitophagy rate, and copy number to slow down heteroplasmy dynamics when mean heteroplasmy is low could have therapeutic advantages for mitochondrial disease and healthy aging.

Keywords: cellular noise; heteroplasmy variance; mitochondrial DNA; mitochondrial networks.


Figures

Figure 1
Figure 1
A simple model bridging mitochondrial networks and genetics yields a wide-reaching, analytically obtained description of heteroplasmy variance dynamics. (A) A population of cells from a tissue exhibit intercellular heterogeneity in mitochondrial content: both mutant load (heteroplasmy) and copy number. (B) Intercellular heterogeneity implies that heteroplasmy is described by a probability distribution. Cells above a threshold heteroplasmy (h*, black dashed line) are thought to exhibit a pathological phenotype. The low-variance distribution (black line) has fewer cells above a pathological threshold heteroplasmy than the high-variance distribution (red line). Heteroplasmy is depicted as an approximately normal distribution, as this is the regime in which our approximations below hold: i.e., when the probability of fixation is small. (C) The chemical reaction network we use to model the dynamics of mitochondrial DNA (see main text for a detailed description). mtDNAs are assigned a genetic state of mutant (M) or wild type (W), and a network state of singleton (i.e., unfused, S) or fused (F). (D) The central result of our work is, assuming that a cell at time t=0 is at its (deterministic) steady state, heteroplasmy variance (V(h)) approximately increases with time (t), mitophagy rate (μ), and the fraction of mitochondria that are unfused (fs), and decreases with mtDNA copy number (n). Importantly, V(h) does not depend on the absolute magnitude of the fission–fusion rates. Also see Table S1 for a summary of our key findings.
Figure 2
Figure 2
General mathematical principles linking heteroplasmy variance to network dynamics. (A) Wild-type and mutant copy numbers and (B) fused and unfused copy numbers both move toward a line of steady states under a deterministic model, as indicated by arrows. In stochastic simulation, (C) mean copy number is initially slightly perturbed from the deterministic treatment of the system and then remains constant, while (D) mean heteroplasmy remains invariant with time (see Equation S61). (E–H) We show that Equation 13 holds across many cellular circumstances: lines give analytic results, points are from stochastic simulation. Heteroplasmy variance behavior is successfully predicted for varying (E) mitophagy rate, (F) steady-state copy number, (G) mutation sensing, and (H) fusion rate. In H, fusion and fission rates are redefined as γγ0MR and ββ0M, where M and R denote the relative magnitude and ratio of the network rates, and γ0,β0 denote the nominal parameterizations of the fusion and fission rates, respectively (see Table S2). Figure S3D shows a sweep of M over the same logarithmic range when R=1. See Figure S4, A–I, and Table S3 for parameter sweeps numerically demonstrating the generality of the result for different mtDNA control modes.
Figure 3
Figure 3
Rate of de novo mutation accumulation is sensitive to the network state/mitophagy rate and copy number for a time-rescaled infinite sites Moran model. (A) An infinite sites Moran model where Q mutations occur per Moran step (see Equation 14). (B–D) Influence of our proposed intervention strategies. (B) Mean number of distinct mutations increases with the fraction of unfused mitochondria. This corresponds to a simple rescaling of time, so all but one of the parameterizations are shown in gray. (C) The mean number of mutations per mtDNA also increases with the fraction of unfused mitochondria. Inset shows that the mean number of mutations per mtDNA is independent of the number of mtDNAs per cell; values of n are the same as in D. (D) Mean number of mutations per cell increases according to the population size of mtDNAs. Standard error in the mean is too small to visualize, so error bars are neglected, given 103 realizations.
Figure 4
Figure 4
Selective fusion implies intermediate fusion rates are optimal for mutant clearance, whereas selective mitophagy implies complete fission is optimal. Numerical exploration of the shift in mean heteroplasmy for varying fusion:fission ratio, across different selectivity strengths. Stochastic simulations for mean heteroplasmy, evaluated at 1000 days, with an initial condition of h=0.3 and n=1000; the state was initialized on the steady-state line for the case of ϵf=ϵm=0, for 104 iterations. (A) For selective fusion (see Equation 15), for each value of fusion selectivity (ϵf), the fusion rate (γ) was varied relative to the nominal parameterization (see Table S2). When ϵf>0, the largest reduction in mean heteroplasmy occurs at intermediate values of the fusion rate; a deterministic treatment reveals this to be true for all fusion selectivities investigated (see Figure S7). (B) For selective mitophagy (see Equation 16), when mitophagy selectivity ϵm>0, a lower mean heteroplasmy is achieved and the lower the fusion rate (until mean heteroplasmy = 0 is achieved). Hence, complete fission is the optimal strategy for selective mitophagy.

References

    1. Acton B., Lai I., Shang X., Jurisicova A., Casper R., 2007. Neutral mitochondrial heteroplasmy alters physiological function in mice. Biol. Reprod. 77: 569–576. 10.1095/biolreprod.107.060806 - DOI - PubMed
    1. Aryaman J., Johnston I. G., Jones N. S., 2017. Mitochondrial DNA density homeostasis accounts for a threshold effect in a cybrid model of a human mitochondrial disease. Biochem. J. 474: 4019–4034. 10.1042/BCJ20170651 - DOI - PMC - PubMed
    1. Aryaman J., Johnston I. G., Jones N. S., 2019. Mitochondrial heterogeneity. Front. Genet. 9: 718 10.3389/fgene.2018.00718 - DOI - PMC - PubMed
    1. Assaf M., Meerson B., 2010. Extinction of metastable stochastic populations. Phys. Rev. E Stat. Nonlin. Soft Matter Phys. 81: 021116 10.1103/PhysRevE.81.021116 - DOI - PubMed
    1. Bagwan N., Bonzon-Kulichenko E., Calvo E., Lechuga-Vieco A. V., Michalakopoulos S., et al. , 2018. Comprehensive quantification of the modified proteome reveals oxidative heart damage in mitochondrial heteroplasmy. Cell Rep. 23: 3685–3697.e4. 10.1016/j.celrep.2018.05.080 - DOI - PubMed

Publication types

Substances