

Heat and Chemical Treatments Affect the Viability, Morphology, and Physiology of Staphylococcus aureus and Its Subsequent Antibody Labeling for Flow Cytometric Analysis
- PMID: 31253681
- PMCID: PMC6696954
- DOI: 10.1128/AEM.01006-19
Heat and Chemical Treatments Affect the Viability, Morphology, and Physiology of Staphylococcus aureus and Its Subsequent Antibody Labeling for Flow Cytometric Analysis
Abstract
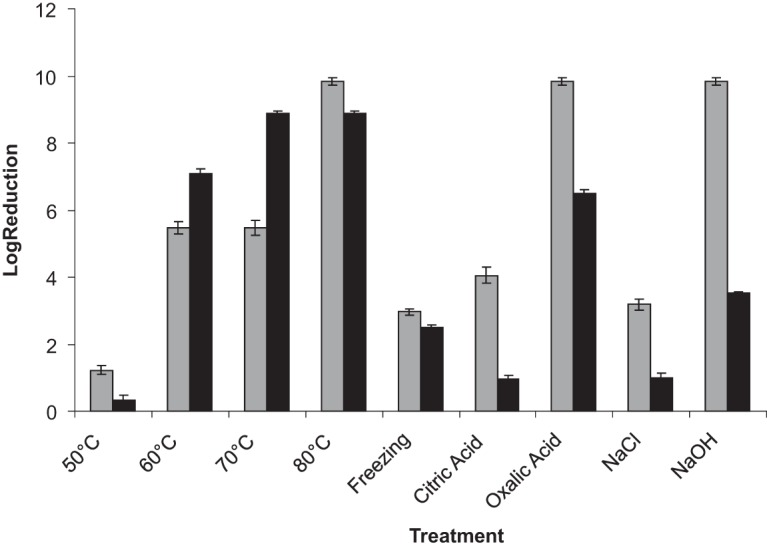
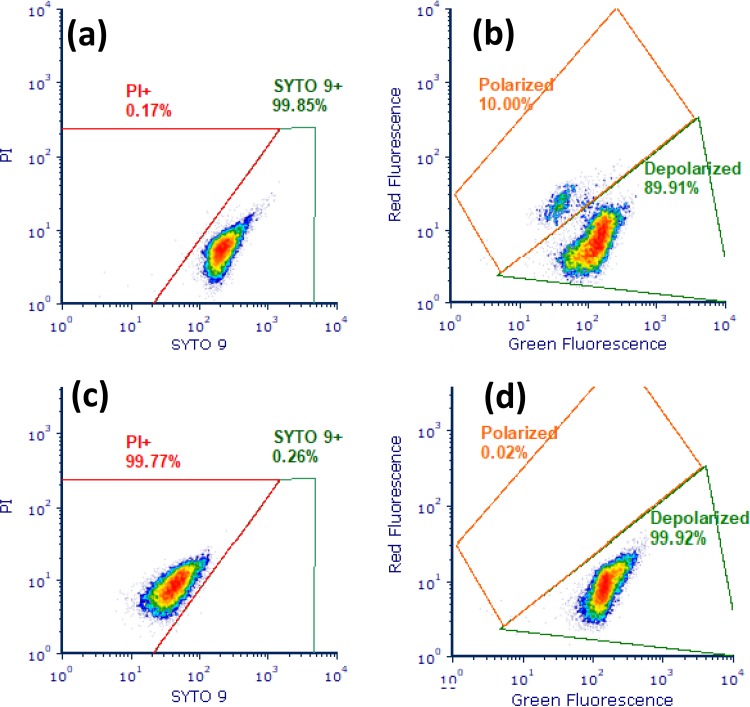
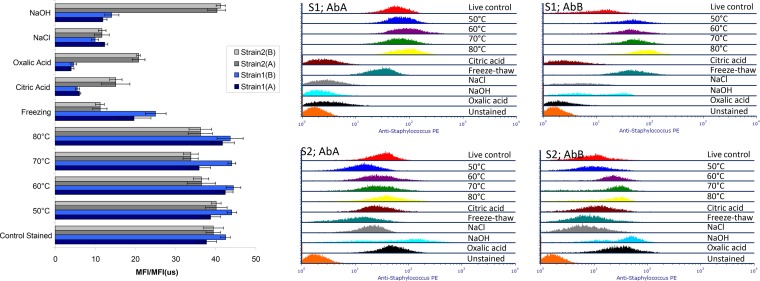
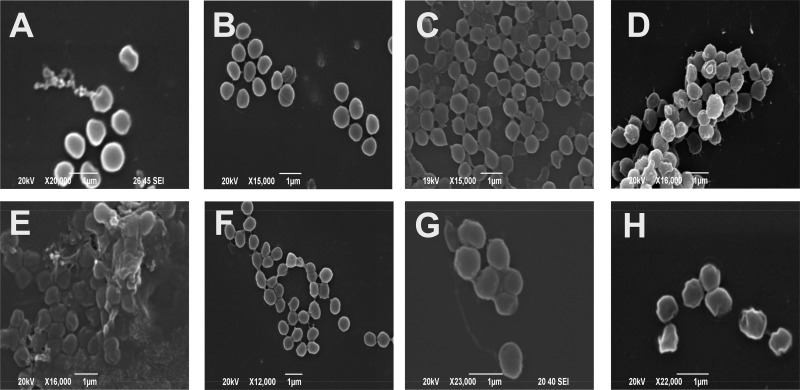
The effects of heat and chemical treatments on Staphylococcus aureus viability and physiology and their subsequent effects on antibody binding ability and cell morphology were measured. Treatments included lethal and sublethal heat; exposure to organic acids, salt, and sodium hydroxide; and freeze-thawing. Strain-related differences in viability were noted depending on treatment and were reflected in changes in physiology as monitored by flow cytometry (FCM) using three different staining protocols: SYTO 9/propidium iodide (PI), DiOC2(3), or calcein acetoxymethyl ester (calcein-AM)/PI. Treatments that resulted in significant losses in viability as measured by plate counting were reflected better by the first two staining combinations, as intracellular calcein-AM uptake may have been impaired by certain treatments. FCM analysis using labeling by commercial anti-S. aureus antibodies indicated that differences in cell physiology as a result of treatments influenced immunofluorescence detection. The ratio of the mean fluorescence intensities of stained cells to those of unstained cells [MFI/MFI(us)] varied with treatment, five of these treatments, including freeze-thaw, citric acid, oxalic acid, NaCl, and NaOH treatments, resulted in significantly lower fluorescence values compared to controls.IMPORTANCE FCM data indicated that cells conventionally considered to be dead and which would not give rise to CFU in a plate count assay, e.g., cells heated to 80°C, were labeled by antibody staining. This finding suggests that without the inclusion of a live/dead discriminating dye, these cells would be erroneously detected as viable within an FCM assay. Reductions in antibody staining due to physicochemical treatment were strain related, reflecting the complexity of the phenomenon under study and illustrating that substantial validation of any new antibody detection-based method, including physiological staining and cell sorting, should be undertaken. Researchers should be aware of physicochemical treatments causing false-negative results: in this study, freeze-thawing severely reduced antibody binding without affecting the viability of a substantial percentage of cells. Scanning electron microscopy carried out on treated cells revealed a range of morphological changes resulting from physicochemical treatments which may have hindered antibody binding.
Keywords: Staphylococcus aureus; antibody-based detection; cell viability; flow cytometry; food-borne pathogens; morphology; physiology.
Copyright © 2019 American Society for Microbiology.
Figures


References
-
- Kennedy D, Cronin UP, Wilkinson MG. 2011. The response of Escherichia coli, Listeria monocytogenes and Staphylococcus aureus to simulated food processing treatments using fluorescence activated cell sorting and plate counting. Appl Environ Microbiol 77:4657–4668. doi:10.1128/AEM.00323-11. - DOI - PMC - PubMed
Publication types
MeSH terms
Substances
LinkOut - more resources
Full Text Sources
Research Materials
Miscellaneous
