. 2019 Jun 28;10(1):2844.
doi: 10.1038/s41467-019-10775-z.

Global impacts of future cropland expansion and intensification on agricultural markets and biodiversity

Affiliations

Global impacts of future cropland expansion and intensification on agricultural markets and biodiversity

Florian Zabel et al. Nat Commun. .

Abstract

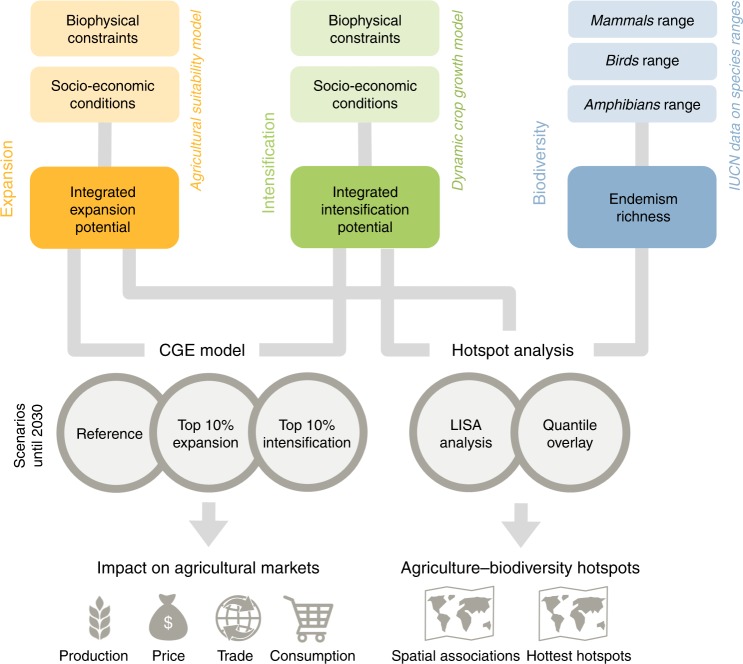
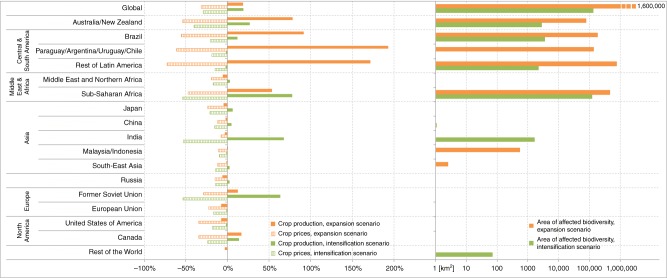
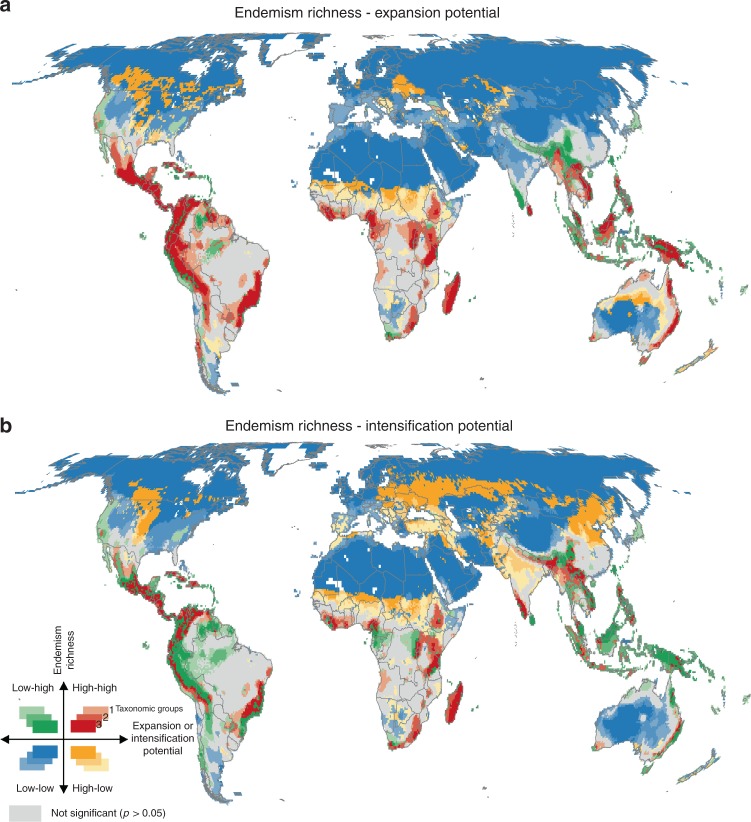
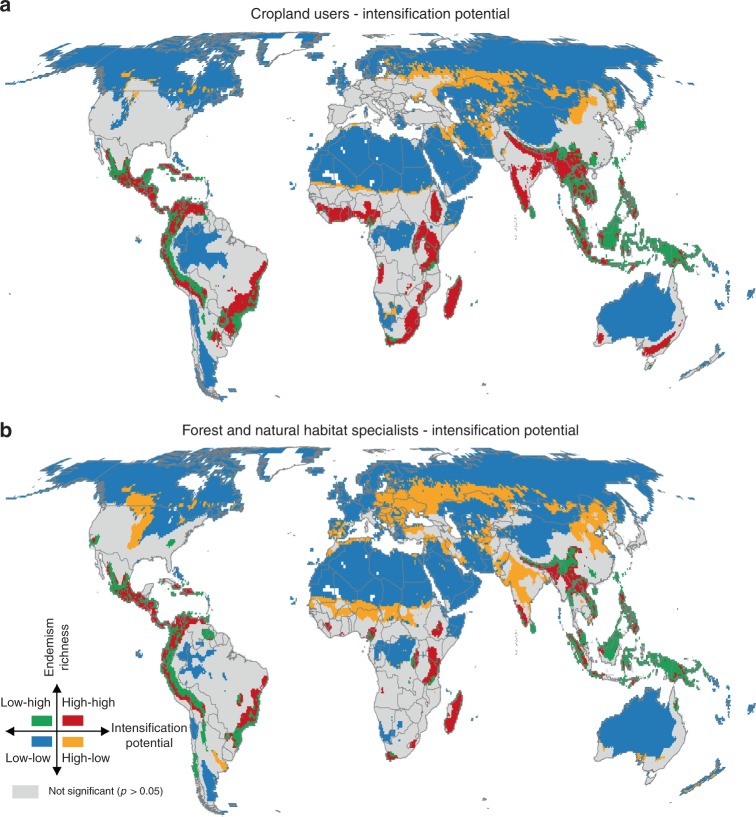
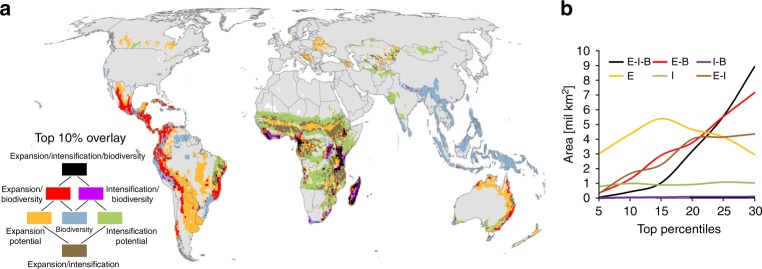
With rising demand for biomass, cropland expansion and intensification represent the main strategies to boost agricultural production, but are also major drivers of biodiversity decline. We investigate the consequences of attaining equal global production gains by 2030, either by cropland expansion or intensification, and analyse their impacts on agricultural markets and biodiversity. We find that both scenarios lead to lower crop prices across the world, even in regions where production decreases. Cropland expansion mostly affects biodiversity hotspots in Central and South America, while cropland intensification threatens biodiversity especially in Sub-Saharan Africa, India and China. Our results suggest that production gains will occur at the costs of biodiversity predominantly in developing tropical regions, while Europe and North America benefit from lower world market prices without putting their own biodiversity at risk. By identifying hotspots of potential future conflicts, we demonstrate where conservation prioritization is needed to balance agricultural production with conservation goals.


Conflict of interest statement

The authors declare no competing interests.

Figures

Fig. 1
Fig. 1
Overview of the study design. The study is based on three sources of data on global cropland expansion, intensification and biodiversity. Both maps of cropland expansion potential and intensification potential are simulated for 17 major agricultural crops at 30 arc sec resolution and integrate information on biophysical constraints (e.g. topography, soil quality, climate change) and socio–economic conditions (e.g. population growth, consumption patterns). The integrated cropland expansion potential is developed by a model of near-future agricultural suitability, while the integrated cropland intensification potential is developed by a dynamic crop growth model. A computable general equilibrium (CGE) model of the world economy, applied to two scenarios of cropland expansion and intensification until 2030, quantifies the impact on agricultural markets in terms of crop production, price, trade and consumption. We use a reference scenario up to 2030 for reference that carries forward current trends in population growth, gross domestic product and trade policies. Endemism richness integrates IUCN range maps of 19,978 species of mammals, birds and amphibians into a global biodiversity metric aggregated at 55-km resolution of an equal-area grid. This metric combines species richness with a measure of endemism (i.e. the range sizes of species within an assemblage) and thus indicates the relative importance of a site for conservation. Hotspot analysis, using Local Indicator of Spatial Association (LISA) and quantile overlay, identifies hotspots where global biodiversity is most affected by near-future cropland expansion and intensification
Fig. 2
Fig. 2
Impacts of expansion and intensification on production, prices and area of affected biodiversity. The left panel shows the change in crop production and prices under expansion and intensification scenarios compared to the reference scenario in 2030, accounting for current trends in population growth, gross domestic product and trade policies. The right panel shows the area of land where the top 10% of the most biodiverse regions are threatened under the expansion and intensification scenario (x-axis for area is scaled logarithmically)
Fig. 3
Fig. 3
Spatial association between endemism richness and potentials for a cropland expansion and b intensification. They are calculated using local indicators of spatial association (LISA) at 55-km resolution. High–high clusters indicate hotspot locations (red), in which areas most suitable for expansion/intensification of cropland are significantly associated with high values of endemism richness (at 0.05 significance level). Low–low clusters (blue) show cold spot locations, in which areas with low potential for expansion/intensification are associated with low values of endemism richness. High–low and low–high clusters show inverse spatial association. Three shades of colours indicate significant results for one, two or all three taxonomic groups (birds, mammals, amphibians)
Fig. 4
Fig. 4
Spatial association between potentials for cropland intensification and endemism richness for a regular or marginal cropland users and b forest or natural habitat specialists. They are calculated using local indicators of spatial association (LISA) at 55-km resolution. High–high clusters indicate hotspot locations (red), in which areas most suitable for intensification of cropland are significantly associated with high values of cropland users/forest or natural habitat specialists (at 0.05 significance level). Low–low clusters (blue) show cold spot locations, in which areas with low potential for intensification are associated with low values of cropland users/forest or natural habitat specialists. High–low and low–high clusters show inverse spatial association
Fig. 5
Fig. 5
Quantile overlay of expansion potential, intensification potential and endemism richness. While a shows the 10th percentile, b shows the sensitivity of the overlay based on selected thresholds between 5 and 30% (see Supplementary Fig. 18 for maps of the different thresholds). The overlay analysis was performed at 55 km resolution of an equal-area grid. The red areas highlight the hottest hotspots, where high biodiversity may be particularly threatened by future cropland expansion. The purple areas highlight the hottest hotspots, where high biodiversity may be particularly affected by future cropland intensification. The black areas pinpoint places where high biodiversity is particularly threatened by both agricultural scenarios simultaneously. The orange, green and blue colours indicate regions with the top 10% of expansion potential, intensification potential and biodiversity that do not overlap with any other top 10% of data. The brown areas indicate regions where the top percentile of expansion and intensification potential overlap without overlapping the top percentile areas of biodiversity. In b, the same colours are used, abbreviating expansion (E), intensification (I) and biodiversity (B)

References

    1. Ramankutty N, Evan AT, Monfreda C, Foley JA. Farming the planet: 1. Geographic distribution of global agricultural lands in the year 2000. Glob. Biogeochem. Cycles. 2008;22:GB1003. doi: 10.1029/2007GB002952. - DOI
    1. Haberl H, et al. Quantifying and mapping the human appropriation of net primary production in earth’s terrestrial ecosystems. Proc. Natl Acad. Sci. USA. 2007;104:12942–12947. doi: 10.1073/pnas.0704243104. - DOI - PMC - PubMed
    1. Seppelt, R., Manceur, A. M., Liu, J., Fenichel, E. P. & Klotz, S. Synchronized peak-rate years of global resources use. Ecol. Soc. 19, 50 (2014).
    1. Kastner T, Rivas MJI, Koch W, Nonhebel S. Global changes in diets and the consequences for land requirements for food. Proc. Natl Acad. Sci. USA. 2012;109:6868–6872. doi: 10.1073/pnas.1117054109. - DOI - PMC - PubMed
    1. Tilman D, Balzer C, Hill J, Befort BL. Global food demand and the sustainable intensification of agriculture. Proc. Natl Acad. Sci. USA. 2011;108:20260–20264. doi: 10.1073/pnas.1116437108. - DOI - PMC - PubMed

Publication types