. 2019 Jun 28;10(1):2886.
doi: 10.1038/s41467-019-10860-3.

MFS transporter from Botrytis cinerea provides tolerance to glucosinolate-breakdown products and is required for pathogenicity

Affiliations

MFS transporter from Botrytis cinerea provides tolerance to glucosinolate-breakdown products and is required for pathogenicity

David Vela-Corcía et al. Nat Commun. .

Abstract

Glucosinolates accumulate mainly in cruciferous plants and their hydrolysis-derived products play important roles in plant resistance against pathogens. The pathogen Botrytis cinerea has variable sensitivity to glucosinolates, but the mechanisms by which it responds to them are mostly unknown. Exposure of B. cinerea to glucosinolate-breakdown products induces expression of the Major Facilitator Superfamily transporter, mfsG, which functions in fungitoxic compound efflux. Inoculation of B. cinerea on wild-type Arabidopsis thaliana plants induces mfsG expression to higher levels than on glucosinolate-deficient A. thaliana mutants. A B. cinerea strain lacking functional mfsG transporter is deficient in efflux ability. It accumulates more isothiocyanates (ITCs) and is therefore more sensitive to this compound in vitro; it is also less virulent to glucosinolates-containing plants. Moreover, mfsG mediates ITC efflux in Saccharomyces cerevisiae cells, thereby conferring tolerance to ITCs in the yeast. These findings suggest that mfsG transporter is a virulence factor that increases tolerance to glucosinolates.


Conflict of interest statement

The authors declare no competing interests.

Figures

Fig. 1
Fig. 1
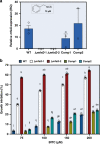
Growth inhibition of B. cinerea and mfsG expression in response to ITCs. a Diameter of B. cinerea colonies was measured 48 h post inoculation on PDA plates supplemented with different concentrations of PITC, BITC or PhITC. Growth inhibition was calculated as percentage of colony diameter of B. cinerea grown on PDA with no ITCs. Data are displayed as mean values (± SE), n > 4. Different letters above the columns indicate significant difference at P < 0.05, as determined by Tukey–Kramer HSD test. b Expression of mfsG 72 h after exposure to different concentrations of PITC (left), BITC (middle) or PhITC (right), as determined by qRT-PCR, relative to expression on PDA without ITCs. n = 3. Source data are provided as a Source Data file
Fig. 2
Fig. 2
Characterization of ΔmfsG mutants and complemented mutants. a Expression analysis of mutants and complemented mutants 72 h after exposure to 75 μM BITC, n = 3. b In vitro growth inhibition 72 h after exposure to different concentrations of BITC. Growth inhibition was calculated as percentage of colony diameter of wild-type (WT) B. cinerea grown on PDA with no ITCs. Data are displayed as mean values (± SE). Different letters above the columns indicate significant difference at P < 0.05, as determined by Kruskal–Wallis test, n = 3. Source data are provided as a Source Data file
Fig. 3
Fig. 3
mfsG confers ITC efflux in B. cinerea. a Fluorescence accumulation in ΔmfsG relative to the wild type (WT) 4 days after exposure to 25 mg ml−1 FITC. b Quantification of fluorescence accumulation in ΔmfsG relative to WT hyphae. Data are displayed as mean values (± SE) of relative fluorescence. Asterisk denotes significant difference by Student’s t test (P< 0.001), n = 10. Scale bars are 20 μm. Source data are provided as a Source Data file
Fig. 4
Fig. 4
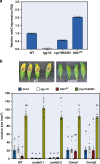
mfsG expression levels and pathogenicity assays on Arabidopsis plants. a mfsG expression analysis 48 h after inoculation of wild-type B. cinerea on Arabidopsis wild type (WT; Col-0), IQD1OE, cyp79B2/B3 and tgg1/2, n = 3. b Pathogenicity of B. cinerea wild type (WT), knockout mutants (ΔmfsG), and complemented mutants (Comp) was evaluated on different Arabidopsis genotypes by measuring lesion sizes 72 h after inoculation with the different B. cinerea strains (representative pictures are presented for Col-0 Arabidopsis leaves inoculated with WT B05.10 or ΔmfsG). Average lesion sizes of 17–20 leaves of each genotype are presented together with the standard errors for each average. Different letters above the columns indicate significant difference at P < 0.05, as determined by Kruskal–Wallis test. Source data are provided as a Source Data file
Fig. 5
Fig. 5
Germination test of B. cinerea ΔmfsG mutants and complemented mutants. The number of double germ tubes in germinating conidia was evaluated by bright-field microscopy 24 h after inoculation of Arabidopsis wild type (WT; Col-0), IQD1OE and tgg1/2 with B. cinerea WT, knockout mutants (ΔmfsG) and complemented mutants (Comp). Data are displayed as mean values (± SE). Different letters above the columns indicate significant difference at P < 0.05, as determined by Tukey–Kramer HSD test, n > 20. Source data are provided as a Source Data file
Fig. 6
Fig. 6
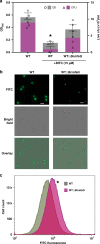
Ectopic expression of B. cinerea mfsG and efflux study in yeast. a Saccharomyces cerevisiae wild-type cells (WT), and cells expressing BcmfsG (WT::BcmfsG) were grown with or without 15 µm BITC in liquid media. OD and live colony-forming units (cfu) were measured after 48 h. Data are displayed as mean values (± SE). Asterisk denotes significant difference by Student’s t test (P< 0.001), n = 3. b S. cerevisiae WT and WT::BcmfsG cells were grown in liquid media with FITC and monitored under a fluorescence microscope 2 h later. c Fluorescence intensity was measured in WT as compared with WT::BcmfsG cells 2 h after exposure to FITC using flow cytometry. Asterisk denotes significant difference by Student’s t test (P< 0.001), n = 100,000 cells. Scale bars are 10 μm. Source data are provided as a Source Data file
Fig. 7
Fig. 7
MFS motif tertiary structure and docking analysis of B. cinerea mfsG. a MFS tertiary structure viewed from the side of the membrane, and rotated through 90°; the conserved 12 transmembrane (TM) α-helix fold is arranged into two 6 TM helix bundles forming a cavity (marked with dashed circle) at the interface between them that is accessible to either the cytoplasm or extracellular region, depending on the conformational state. b Molecular docking between BITC molecule and MFS revealed a putative binding site formed by residues located in the internal channel of MFS. The proposed binding region is formed by the aromatic rings of residues Trp54, Phe254, Gln344, and Phe369. c Distances were measured between the BITC molecule and side chains of these residues, where the biggest distance was 4.175 Å with Phe254
Fig. 8
Fig. 8
Phylogenetic and structural analysis of mfsG and mfs-like proteins. a Phylogenetic analysis was performed using amino-acid sequences of MFS proteins with at least 40% identity to mfsG from different fungi. All of these sequences were clustered into two clearly differentiated clades. One group contained B05.10 mfsG and similar proteins (yellow). The other clade consisted of three subclades: one of them (blue) contained B05.10 mfs-like1 and its homologs, and another (pink) contained B05.10 mfs-like2 and its homologs and a third that do not contain B05.10 homolog (black). Isolate name and protein ID are in parentheses. Bootstrapping (1000 replicates/iterations) was used to generate the phylogenetic tree with the neighbor-joining algorithm in MEGA7. b Alignment of amino-acid sequence of three MFSs from B. cinerea B05.10 (mfsG, mfs-like1, and mfs-like2). Residues located in the proposed binding site to ITCs are highlighted (green triangles). c Three-dimensional structure and hydrophobicity representation of mfsG, mfs-like1, and mfs-like2 from B. cinerea B05.10. d Comparison of three-dimensional structures of mfsG, mfs-like1, and mfs-like2

Similar articles

Cited by

References

    1. Ahuja I, Kissen R, Bones AM. Phytoalexins in defense against pathogens. Trends Plant Sci. 2012;17:73–90. doi: 10.1016/j.tplants.2011.11.002. - DOI - PubMed
    1. Arbona V, Gómez-Cadenas A. Metabolomics of disease resistance in crops. Curr. Issues Mol. Biol. 2016;19:13–30. - PubMed
    1. Smith DA, Banks SW. Formation and biological properties of isoflavonoid phytoalexins. Prog. Clin. Biol. Res. 1986;213:113–124. - PubMed
    1. VanEtten HD, Mansfield JW, Bailey JA, Farmer EE. Two classes of plant antibiotics: phytoalexins versus “Phytoanticipins”. Plant Cell. 1994;6:1191–1192. doi: 10.1105/tpc.6.9.1191. - DOI - PMC - PubMed
    1. Morrissey JP, Osbourn AE. Fungal resistance to plant antibiotics as a mechanism of pathogenesis. Microbiol. Mol. Biol. Rev. 1999;63:708–724. - PMC - PubMed