. 2019 Jun 28;9(1):9411.
doi: 10.1038/s41598-019-45844-2.

Intracellular Zn2+ transients modulate global gene expression in dissociated rat hippocampal neurons

Affiliations

Intracellular Zn2+ transients modulate global gene expression in dissociated rat hippocampal neurons

Lynn Sanford et al. Sci Rep. .

Abstract

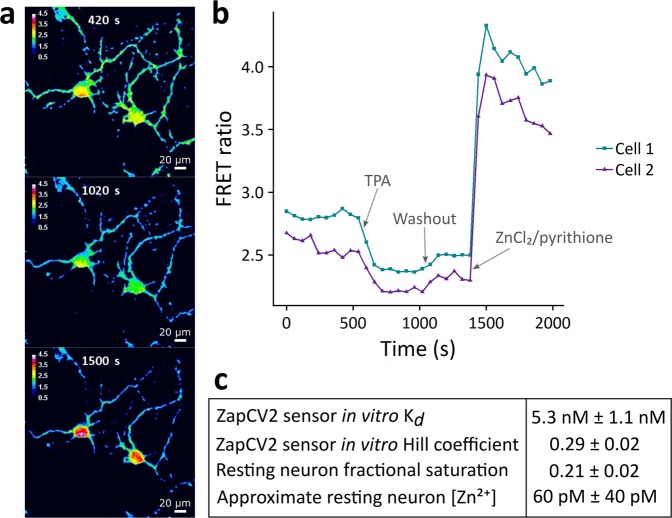
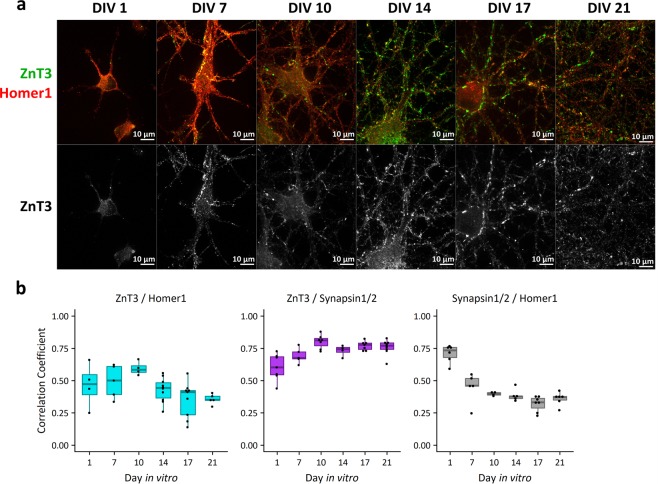
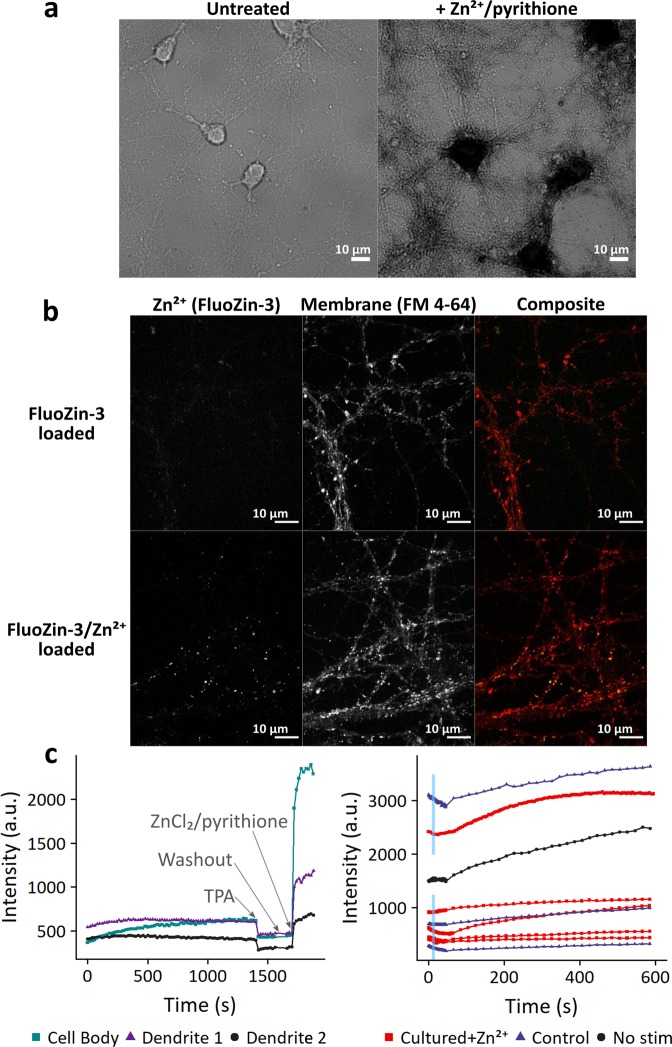
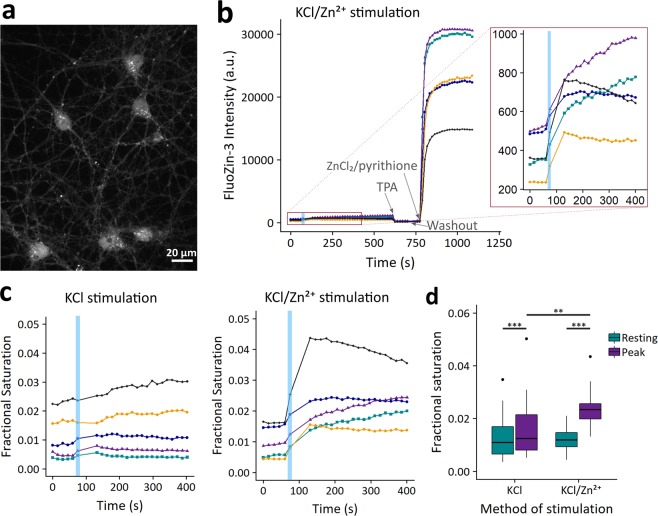
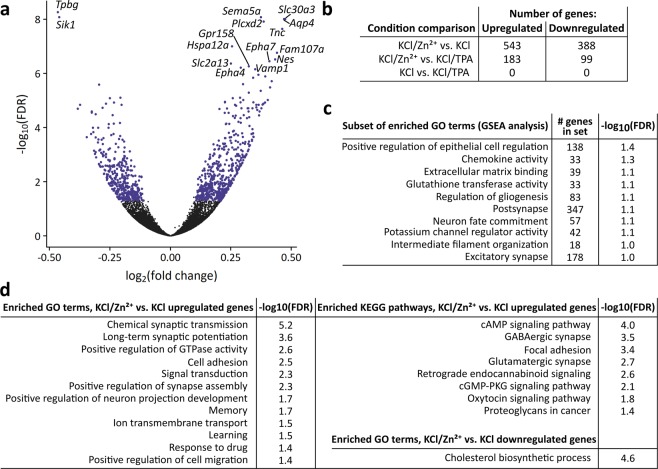
Zinc (Zn2+) is an integral component of many proteins and has been shown to act in a regulatory capacity in different mammalian systems, including as a neurotransmitter in neurons throughout the brain. While Zn2+ plays an important role in modulating neuronal potentiation and synaptic plasticity, little is known about the signaling mechanisms of this regulation. In dissociated rat hippocampal neuron cultures, we used fluorescent Zn2+ sensors to rigorously define resting Zn2+ levels and stimulation-dependent intracellular Zn2+ dynamics, and we performed RNA-Seq to characterize Zn2+-dependent transcriptional effects upon stimulation. We found that relatively small changes in cytosolic Zn2+ during stimulation altered expression levels of 931 genes, and these Zn2+ dynamics induced transcription of many genes implicated in neurite expansion and synaptic growth. Additionally, while we were unable to verify the presence of synaptic Zn2+ in these cultures, we did detect the synaptic vesicle Zn2+ transporter ZnT3 and found it to be substantially upregulated by cytosolic Zn2+ increases. These results provide the first global sequencing-based examination of Zn2+-dependent changes in transcription and identify genes that may mediate Zn2+-dependent processes and functions.


Conflict of interest statement

The authors declare no competing interests.

Figures

Figure 1
Figure 1
Genetically encoded Zn2+ FRET sensor measurements in resting neurons. (a) Images displaying the FRET ratio (FRET channel intensity/CFP channel intensity) of relevant neuronal areas within a field of view. Cells and times correspond to the traces in part (b) and picture resting (top), minimal (middle), and maximal (bottom) ratios obtained during a calibration. (b) Sample traces from a typical FRET sensor calibration. Each trace is derived from a region of interest in two separate cells within one field of view. Resting FRET ratios were observed, followed by treatment with 10 µM TPA and subsequently 10 µM ZnCl2/2.5 µM pyrithione to determine minimum and maximum FRET ratios, respectively. (c) Quantification of Zn2+ based on the in vitro binding parameters of the sensor. Errors correspond to standard error of the mean. n = 14 cells from 6 separate biological replicates derived from 2 separate cell preparations.
Figure 2
Figure 2
Expression and localization of Zn2+ transporter ZnT3 in cultured neurons by immunofluorescence. (a) ZnT3 (synaptic vesicle Zn2+ transporter, pseudocolored green or displayed in grayscale below) and Homer1 (post-synaptic density protein, pseudocolored red) are stained at different timepoints in culture. ZnT3 increases in expression over time in culture, and shows synaptic localization starting at DIV 10. Channel intensities of all images are scaled identically. (b) 2D correlation coefficients calculated on raw immunofluorescence images. Smaller correlation coefficients are more likely to represent less colocalization. ZnT3 maintains a high correlation coefficient compared to Synapsin1/2 across the time course, whereas Synapsin1/2 compared to Homer1 and ZnT3 compared to Homer1 decrease over time. Each DIV/protein comparison is one biological replicate, with each dot representing a separate field of view within the sample.
Figure 3
Figure 3
Attempts to visualize Zn2+ in synaptic vesicles. (a) Timm’s stain of neurons at DIV 10. Cultures were stained +/− treatment with 20 µM ZnCl2/2.5 µM pyrithione for 8 minutes prior to staining. Timm’s stain was visible in cell bodies and processes of treated neurons (right), but not visible under endogenous Zn2+ conditions (left). (b) Dye loading of stimulated neurons. Cultures were electrically stimulated in the presence of extracellular fluorescent dyes FluoZin-3 (10–50 µM, green) and FM 4–64 (5 µM, red), then washed to allow visualization of internalized dye. In some samples, 10 µM ZnCl2 was added to media before and during stimulation. FluoZin-3 puncta present upon co-incubation with Zn2+ indicate successful dye loading; however, no puncta are visible under endogenous Zn2+ conditions.
Figure 4
Figure 4
Intracellular Zn2+ signal in stimulated neurons. (a) Image of neurons treated with FluoZin-3 AM after stimulation with KCl in the presence of 10 µM ZnCl2. (b) Sample traces from a typical stimulation experiment. Each trace is derived from a region of interest within a different cell. 50 mM KCl stimulation was applied for 10 seconds (blue box) along with 10 µM ZnCl2, followed by a washout period and further imaging. Samples were calibrated by addition of 10 µM Zn2+ chelator TPA and then 10 µM ZnCl2/2.5 µM pyrithione in order to determine minimal and maximal signal for calculation of fractional saturation. Inset shows greater resolution for the time period around stimulation. Fluorescence intensity is background-corrected. (c) Sample traces from typical experiments described in (b), displayed as the calculated fractional saturation. Representative traces are shown for samples treated with KCl in the absence (left) or presence (right) of 10 μM extracellular ZnCl2. For clarity, only the first 400 seconds are shown. (d) Box plot of FluoZin-3 fractional saturation levels at rest and at peak level after KCl stimulation with or without 10 µM extracellular ZnCl2. n = 32 cells in 3 separate biological replicates for KCl stimulation alone and n = 18 cells in 3 separate biological replicates for the KCl/Zn2+ condition. Dots correspond to outliers, defined as points lying over (3rd quartile + 1.5 × (interquartile range)). ***p < 0.001 or **p < 0.01 as assessed with a two-sided Wilcox Signed Rank test for paired data within conditions (KCl: test statistic V = 0, p = 4.6e-10; KCl/Zn2+: test statistic V = 0, p = 7.6e-09) and a two-sided Mann-Whitney U unpaired test between the KCl and KCl/Zn2+ resting and peak conditions (test statistic W = 131, p = 0.0012). No significant difference between resting conditions was observed (test statistic W = 276, p = 0.818).
Figure 5
Figure 5
RNA-Seq of dissociated hippocampal neurons stimulated with and without Zn2+ or Zn2+-specific chelator TPA. (a) Volcano plot of gene expression for all genes between KCl/Zn2+ and KCl stimulation conditions, providing measures of how much gene expression changed and the confidence in calling that gene differentially expressed. Positive fold changes indicate that genes were upregulated in the KCl/Zn2+ condition. The top 13 upregulated and 2 downregulated genes have been labeled (all genes with FDR < 10−6). FDR = false discovery rate, a commonly used metric to assess significance among many hypothesis tests. Blue dots highlight all genes deemed significantly differentially expressed, with fold change magnitude >0.1 and FDR < 0.05. (b) Number of genes differentially expressed in pairwise comparisons of conditions. (c) Gene Set Enrichment Analysis (GSEA) results examining whether sets of genes associated with certain human gene ontology terms are enriched among genes upregulated in the KCl/Zn2+ condition as compared to the KCl condition. These gene sets are a relevant subset of 50 gene sets found to be enriched with an FDR < 0.1. (d) Analysis of enrichment of GO terms and KEGG pathways between KCl/Zn2+ and KCl conditions as assessed using the DAVIDtools online functional annotation tool. Enrichment is assessed as terms/pathways being proportionally more associated with the differentially expressed genes than with the transcriptome as a whole. All terms and pathways are listed that were found to be enriched in upregulated or downregulated genes with an FDR < 0.05. FDR = false discovery rate, GO = gene ontology, KEGG = Kyoto Encyclopedia of Genes and Genomes.

References

    1. Kalappa, B. I. & Tzounopoulos, T. Context-Dependent Modulation of Excitatory Synaptic Strength by Synaptically Released Zinc. eNeuro4 (2017). - PMC - PubMed
    1. Pan E, et al. Vesicular zinc promotes presynaptic and inhibits postsynaptic long-term potentiation of mossy fiber-CA3 synapse. Neuron. 2011;71:1116–1126. doi: 10.1016/j.neuron.2011.07.019. - DOI - PMC - PubMed
    1. Takeda A, Kanno S, Sakurada N, Ando M, Oku N. Attenuation of hippocampal mossy fiber long-term potentiation by low micromolar concentrations of zinc. J. Neurosci. Res. 2008;86:2906–2911. doi: 10.1002/jnr.21732. - DOI - PubMed
    1. McAllister BB, Dyck RH. Zinc Transporter 3 (ZnT3) and Vesicular Zinc in Central Nervous System Function. Neuroscience & Biobehavioral Reviews. 2017;80:329–350. doi: 10.1016/j.neubiorev.2017.06.006. - DOI - PubMed
    1. Haase H, et al. Zinc Signals Are Essential for Lipopolysaccharide-Induced Signal Transduction in Monocytes. J. Immunol. 2008;181:6491–6502. doi: 10.4049/jimmunol.181.9.6491. - DOI - PubMed

Publication types