. 2019 Jul;51(7):1160-1169.
doi: 10.1038/s41588-019-0455-2. Epub 2019 Jun 28.

High-throughput identification of human SNPs affecting regulatory element activity

Affiliations

High-throughput identification of human SNPs affecting regulatory element activity

Joris van Arensbergen et al. Nat Genet. 2019 Jul.

Abstract

Most of the millions of SNPs in the human genome are non-coding, and many overlap with putative regulatory elements. Genome-wide association studies (GWAS) have linked many of these SNPs to human traits or to gene expression levels, but rarely with sufficient resolution to identify the causal SNPs. Functional screens based on reporter assays have previously been of insufficient throughput to test the vast space of SNPs for possible effects on regulatory element activity. Here we leveraged the throughput and resolution of the survey of regulatory elements (SuRE) reporter technology to survey the effect of 5.9 million SNPs, including 57% of the known common SNPs, on enhancer and promoter activity. We identified more than 30,000 SNPs that alter the activity of putative regulatory elements, partially in a cell-type-specific manner. Integration of this dataset with GWAS results may help to pinpoint SNPs that underlie human traits.


Conflict of interest statement

Competing interest statement

J.v.A. is founder of Gen-X B.V. (http://www.gen-x.bio/). E.d.W. is co-founder and shareholder of Cergentis B.V.. F.C. is a co-founder of enGene Statistics GmbH.

Figures

Fig. 1
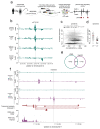
Fig. 1. Identification of raQTLs by SuRE.
a. Schematic representation of the SuRE experimental strategy. ORF, open reading frame; PAS, polyadenylation signal. Colors indicate different barcodes. SuRE yields orientation-specific activity information (SuRE +/- tracks, right-hand panel). b. SuRE signals from the four genomes in an example locus, showing differential SuRE activity at raQTL rs6739165, depending on the allele (A or C) present. c. SuRE activity for all fragments containing rs6739165. N.D., not detected. SuRE data of + and - orientations are combined. Values on the y-axis were shifted by a random value between -0.5 and 0.5 in order to better visualize DNA fragments with the same value. P < 2.2 × 10⁻¹⁶, according to two-sided Wilcoxon rank-sum test. d. Same data as in (c), but only the expression value for each fragment is shown (without the addition of the random value). Red lines indicate mean values. e. Numbers of raQTLs in K562, HepG2, or both. f. Example of a locus showing differential SuRE activity for 2 genomes in HepG2 only. Below the SuRE tracks known transcript variants of POU2AF1 are indicated, and RNA-seq data from K562 and HepG2 (data from28).
Fig. 2
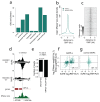
Fig. 2. Correlation of SuRE signals with local chromatin states.
a. Enrichment or depletion of 19,237 raQTLs among major types of chromatin in K562 relative to all SNPs analyzed. All values are significantly different from 1 (P < 2.2 × 10⁻¹⁶, two-sided Fisher exact test). b. Average profile of DNase-seq enrichment for the 19,237 raQTLs compared to an equally sized random set of analyzed SNPs. c. DNase-seq signals aligned to the 19,237 raQTLs, sorted by their P value according to our SuRE analysis (lowest P value on top). d-e. Example of a SNP with differential SuRE activity for the two alleles, overlapping with a DNase-seq peak in K562 cells (d) and showing only DNase sensitivity for one allele, even though both alleles are present in the K562 genome. Note that K562 cells are aneuploid, hence the balance of the alleles in input DNA may not be 1:1 (e). P value according to two-sided Fisher exact test. f. Comparison of allelic imbalance of SuRE signals and DNase-seq signals (normalized for genomic DNA allelic read counts) for 616 raQTLs for which K562 cells are heterozygous. REF: reference allele; ALT: alternative allele; OR: odds-ratio. g. Same as in (f) but for a random set of 616 control SNPs overlapping with a DNase-seq peak. DNase-seq data in b-g are from.
Fig. 3
Fig. 3. Concordance of SuRE data and predictions based on TF binding motifs.
a. Comparison of the sequence flanking raQTL rs12985827 (same SNP as in Fig. 2d-e) and the sequence logo for EGR1. The T allele disrupts a conserved nucleotide in the EGR1 binding motif. b. Compared to all SNPs (n = 5,919,293), raQTLs in K562 (n = 19,237) and HepG2 (n = 14,183) both overlap preferentially with computationally predicted alterations of TF binding motifs according to SNP2TFBS. Asterisks, P < 2.2 × 10⁻¹⁶, according to two-sided Fisher exact test. c. Concordance between the predicted increase or decrease in TF binding according to SNP2TFBS, and the observed effect in SuRE, assuming that decreased TF binding typically leads to decreased activity of a regulatory element. Asterisks, P < 2.2 × 10⁻¹⁶, according to two-sided Fisher exact test. d. TF motif alterations that are preferentially present among raQTLs in either K562 or HepG2 cells. Only the 7 most enriched TF motifs for each cell type are shown.
Fig. 4
Fig. 4. Candidate causal SNPs identified by SuRE among large sets of eQTL SNPs.
a. SuRE signals in HepG2 cells for eQTL SNPs previously identified for the XPNPEP2 gene in liver according to GTEx v7. Top panel: SuRE data in HepG2 cells. Top and bottom of each bar indicate the SuRE signal of the strongest and weakest allele, respectively. Width of the bars is proportional to the –log10(P value) obtained by a two-sided Wilcoxon rank-sum test; color indicates whether the eQTL effect orientation is concordant or discordant with the SuRE effect orientation. Middle panel: positions of significant eQTL SNPs with the associated eQTL -log10(P values) according to GTEx v7. Bottom panel: gene annotation of XPNPEP2 and DNase-seq data from HepG2 cells. b. Same as (a), but for ABCC11 (dark red). c. Zoom in of (b). d. Sequence of rs11866312 ± 12 bp aligned to the binding motif of FOXA1. e. Same as (a) but for YEATS4 with SuRE data from K562 cells and eQTL data from whole blood (GTEx v78). In (a-c, e), eGenes are shown in the bottom panels in dark red and all other genes in gray; coverage numbers in the top panels indicate the number of SNPs with SuRE data out of the total number eQTL SNPs. f. Mass-spectrometry analysis of proteins from a K562 cell extract binding to 25-bp double-stranded DNA oligonucleotides containing either the A or G allele of rs623853. The experiment was performed once with heavy labeling of proteins bound to the A allele and light labeling of proteins bound to the G allele (x-axis), and once with reverse labeling orientation (y-axis). g. Sequence of the DNA probes used in (f) aligned to the binding motif of ELF1.
Fig. 5
Fig. 5. Candidate causal SNPs identified by SuRE among large sets of GWAS SNPs.
a. Distribution of distances between lead SNPs for blood traits and raQTLs (black) and a set of matched control SNPs (gray). P value was obtained with a two-sided Wilcoxon rank-sum test. raQTLs in K562 cells are modestly enriched near blood GWAS lead SNPs. P value was obtained using two-sided Wilcoxon rank-sum test. b. Overlay of SuRE and GWAS data for a cluster of GWAS SNPs linked to hemoglobin concentration. Top panel: SuRE data in K562 cells. Top and bottom end of each bar indicate the SuRE signal of the strongest and weakest allele, respectively. Color of the bars indicates which allele is stronger. Width of the bars is proportional to –log10(P value). Middle panel: positions of significant GWAS SNPs with the associated -log10(P values) on the y-axis. Bottom panel: gene annotation (dark red: SH2B3) and DNase-seq data from K562 cells. c. Protein binding analysis as in Fig. 4f, for rs4572196. d. Sequence of the probes used in (c) aligned to sequence logo for JUNB. e. Same as (b) but for a cluster of SNPs associated with reticulocyte counts by GWAS. f. Fraction of reads containing each of the two alleles of rs3748136 in K562 genomic DNA and K562 DNase-seq reads. P value was obtained with a two-sided Fisher exact test. g. Same as (c) but for rs3748136. h. Sequence of the probes used in (g) aligned to binding motifs for JUNB and BACH1. i. Fraction of reads containing each of the two alleles of rs3748136 in K562 genomic DNA (left) and K562 ChIP-seq reads for BACH1 (right). j. Same as (i) but for ChIP-seq reads for JUND. ChIP data are from. k. Association between alleles of rs3748136 and NR_125431 expression in whole blood according to GTEx. Red lines indicate median. l. Expression of NR_125431 in subclones derived from K562 clone BL_2 subjected to CRISPR/Cas9 editing of rs1053036. Sixteen unaltered subclones and eleven G->A edited subclones were assayed by RT-qPCR of NR_125431 (normalized to GAPDH). P value was obtained with a two-sided Wilcoxon rank-sum test. Red lines indicate medians. One G->A subclone appeared to have reverted to the completely inactive state seen in many K562 clones initially derived from the cell pool (Supplementary Fig. 5c).
Fig. 6
Fig. 6. Candidate causal SNPs identified by SuRE among GWAS SNPs for hepatocellular carcinoma.
Comparison of SuRE and GWAS data for a cluster of GWAS SNPs linked to hepatocellular carcinoma. Top panel: SuRE data in HepG2 cells. The top and bottom end of each bar indicate the SuRE signal of the strongest and weakest allele, respectively. Color of the bars indicates which allele is stronger. Width of the bars is proportional to –log10(P value) obtained by a two-sided Wilcoxon rank-sum test. Middle panel: positions of significant GWAS SNPs with the associated -log10(P values) on the y-axis. Bottom panel: gene annotation track and DNase-seq data from HepG2 cells.

References

    1. 1000 Genomes Project Consortium. A global reference for human genetic variation. Nature. 2015;526:68–74. - PMC - PubMed
    1. Gusev A, et al. Partitioning heritability of regulatory and cell-type-specific variants across 11 common diseases. Am J Hum Genet. 2014;95:535–52. - PMC - PubMed
    1. Albert FW, Kruglyak L. The role of regulatory variation in complex traits and disease. Nat Rev Genet. 2015;16:197–212. - PubMed
    1. Miguel-Escalada I, Pasquali L, Ferrer J. Transcriptional enhancers: functional insights and role in human disease. Curr Opin Genet Dev. 2015;33:71–6. - PMC - PubMed
    1. Deplancke B, Alpern D, Gardeux V. The Genetics of Transcription Factor DNA Binding Variation. Cell. 2016;166:538–554. - PubMed

Publication types

Substances