. 2019 Aug;54(8):716-727.
doi: 10.1002/jms.4384.

A recommended and verified procedure for in situ tryptic digestion of formalin-fixed paraffin-embedded tissues for analysis by matrix-assisted laser desorption/ionization imaging mass spectrometry

Affiliations

A recommended and verified procedure for in situ tryptic digestion of formalin-fixed paraffin-embedded tissues for analysis by matrix-assisted laser desorption/ionization imaging mass spectrometry

Audra M Judd et al. J Mass Spectrom. 2019 Aug.

Abstract

Matrix-assisted laser desorption/ionization imaging mass spectrometry (MALDI IMS) is a molecular imaging technology uniquely capable of untargeted measurement of proteins, lipids, and metabolites while retaining spatial information about their location in situ. This powerful combination of capabilities has the potential to bring a wealth of knowledge to the field of molecular histology. Translation of this innovative research tool into clinical laboratories requires the development of reliable sample preparation protocols for the analysis of proteins from formalin-fixed paraffin-embedded (FFPE) tissues, the standard preservation process in clinical pathology. Although ideal for stained tissue analysis by microscopy, the FFPE process cross-links, disrupts, or can remove proteins from the tissue, making analysis of the protein content challenging. To date, reported approaches differ widely in process and efficacy. This tutorial presents a strategy derived from systematic testing and optimization of key parameters, for reproducible in situ tryptic digestion of proteins in FFPE tissue and subsequent MALDI IMS analysis. The approach describes a generalized method for FFPE tissues originating from virtually any source.

Keywords: MALDI imaging mass spectrometry; colon; formalin-fixed paraffin-embedded tissue; in situ tryptic digestion; molecular histology.


Figures

Figure 1.
Figure 1.. Workflow for in situ digestion using robotic spray application of trypsin for MALDI IMS peptide analysis of FFPE tissues.
Steps that were optimized within the framework developed herein are highlighted in gray, with tested parameters listed.
Figure 2.
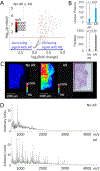
Figure 2.. Antigen retrieval.
A) Differences in MALDI ion peak intensities from tissue processed with or without antigen retrieval (AR). Ions above the red dotted line have signal intensities that are significantly different between conditions (p<0.05). All data were derived from three biological replicates (with three technical replicates each). B) The number of identifications determined by LC-MS/MS analysis of microextractions (reverse hits and proteins identified by fewer than 2 peptides were not counted). No AR: 37 ± 11 proteins and 139 ± 31 peptides; AR: 137 ± 32 proteins and 1,167 ± 71 peptides. Means between AR and No AR were found to be significantly different using an unpaired t-test in GraphPad Prism version 5.04. Data were derived from 3 technical replicates of one patient sample. C) MALDI IMS of m/z 1459.7 ± 0.2 from tissue treated without (left) or with antigen retrieval (middle). H&E stained FFPE colon tissue (right); the black box shows the region imaged. D) MALDI IMS summary spectra showing average tissue signal without (top) and with (bottom) antigen retrieval. Sample preparation: tissues were sprayed with trypsin (0.64 ng/mm2 final) and digested at 37 °C overnight in a chamber containing 100 μL of 100 mM ammonium bicarbonate. Microextractions were collected and then 5 mg/mL CHCA in 90% acetonitrile, 0.1% TFA was sprayed onto the tissues. Samples were rehydrated with 50 μL of 50 mM acetic acid at 85 °C for 3 min.
Figure 3.
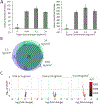
Figure 3.. Optimization of trypsin concentration – maximizing peptide signal.
A) LC-MS/MS analysis of microextractions from tissues digested with varying amounts of trypsin. Means were compared using one-way ANOVA in GraphPad Prism version 5.04. Changes in proteomics results produced by altering trypsin concentration from 0.64–24 ng/mm2 were not statistically significant (p<0.05) when compared to one another, but control experiments with no trypsin added (0 ng/mm2) resulted in a statically significant (p<0.05) diminishment of peptide and proteins detected (asterisk). Error bars represent standard deviation from three technical replicates of one patient sample. B) The overlap of all proteins identified by LC-MS/MS in at least two out of three technical replicates per condition. This plot was made using EulerAPE_3.0.0.[41] C) Differences in MALDI ion peak intensities from tissue digested with various concentrations of trypsin. Ions above the red dotted line have signal intensities that are significantly different between conditions (p<0.05). Data were derived from three technical replicates from each of three patient samples. Sample Preparation: tissues were processed with antigen retrieval and, after trypsin deposition, were digested overnight at 37 °C in a chamber containing 100 μL of 100 mM ammonium bicarbonate. Microextractions were collected and then 5 mg/mL CHCA in 90% acetonitrile, 0.1% TFA was sprayed onto the tissue. Samples were rehydrated with 50 μL of 50 mM acetic acid at 85°C.
Figure 4.
Figure 4.. Optimization of trypsin concentration-IMS performance.
A-D) MALDI summary spectra (left) and two representative ion images (right) when A) 0, B) 0.64, C) 3.2, or D) 24 ng/mm2 of trypsin were used for digestion. Ion images represent: m/z 1235.7 ± 0.3 (left) and m/z 1671.0 ± 0.5 (right). Sample preparation: tissues were processed with antigen retrieval and, after trypsin deposition, were digested overnight at 37 °C in a chamber containing 100 μL of 100 mM ammonium bicarbonate. 5 mg/mL CHCA in 90% acetonitrile, 0.1% TFA was sprayed onto the tissue. Samples were rehydrated with 50 μL of 50 mM acetic acid at 85°C.
Figure 5.
Figure 5.. Digestion chamber buffer volume.
A-D) MALDI summary spectra (left) when A) 0, B) 100, C) 500, or D) 1000 μL of 100 mM ammonium bicarbonate were placed in the digestion chamber and three representative ion images: m/z 1326.2 ± 0.2 (left), m/z 1753.2 ± 0.2 (center), and m/z 2271.5 ± 0.2 (right), E-F) The number of E) proteins and F) peptides identified from tissue microextractions after tissues were digested in a chamber containing various amounts of ammonium bicarbonate. Data represent three technical replicates taken from each of three biological replicates. All concentrations were significantly different from 0 μL of 100 mM ammonium bicarbonate (asterisks, p value <0.05) but not different from each other. Error bars represent the standard error among the technical replicate averages from each of three patient samples. G) The overlap of proteins identified by LC-MS/MS in at least two out of three technical replicates per condition. Areas and values represent the average of three patient samples. This plot was made using EulerAPE_3.0.0.[41] Sample preparation: tissues were antigen retrieved, sprayed with trypsin (0.64 ng/mm2, final), and digested. Microextractions were collected, and then 5 mg/mL CHCA in 90% acetonitrile, 0.1% TFA was sprayed onto the tissues. Samples were rehydrated with 50 μL of 50 mM acetic acid at 85 °C.
Figure 6.
Figure 6.. Maintaining analyte localization during digestion.
Ion images and average mass spectra resulting from overnight digestion with various amounts of ammonium bicarbonate in the digestion chamber: A) 100, B) 500, and C) 1000 μL. Left side ion images: m/z 1547.9 ± 0.2 (green), m/z 1032.7 ± 0.2 (magenta). Right side ion images: m/z 1460.5 ± 0.2 (green), m/z 1236.3 ± 0.2 (magenta). Sample preparation: tissues were antigen retrieved, sprayed with trypsin (3.2 ng/mm2, final), and digested overnight. 5 mg/mL CHCA in 90% acetonitrile, 0.1% TFA was sprayed onto tissues. No rehydration was performed.
Figure 7.
Figure 7.. Digestion length.
A) MALDI ion images of m/z 1546.9 ± 0.2 and m/z 1032.9 ± 0.2 from FFPE colon tissue digested for 2 h (left) or overnight (16–18 h, right). B) Differences in MALDI ion peak intensities from tissues digested for 2 h or overnight. Ions above the red dotted line have signal intensities that are significantly different between conditions (p<0.05). Data were combined from three technical replicates taken from each of three biological replicates. C-E) LC-MS/MS analysis of microextractions from colon tissues digested for 2 h or overnight (ON, 16–18 h). C) The overlap of all proteins identified by LC-MS/MS in at least two out of three technical replicates per condition. This plot was made using The Venn Diagram Plotter provided by PNNL (https://omics.pnl.gov/software/venn-diagram-plotter). D-E) The number of proteins and peptides identified from each condition. Means were compared by one-way ANOVA using GraphPad Prism version 5.04. All groups were significantly different from 0 h (*, p value <0.05) but not different from each other. The number of peptides identified using overnight digestion was statistically greater than using the 2 h digestion (ǂ, p value <0.05). Data are from three technical replicates. Sample preparation: tissues were antigen retrieved, sprayed with trypsin (3.2 ng/mm2 final for panel A; 0.64 ng/mm2 final for panels B-E), and digested in a chamber containing 100 μl of 100 mM ammonium bicarbonate. Microextractions were collected and 5 mg/mL CHCA in 90% acetonitrile, 0.1% TFA was sprayed onto the tissues. Either no rehydration was performed (panel A) or samples were rehydrated with 50 μL of 50 mM acetic acid at 85 °C (panels B-E).
Figure 8.
Figure 8.. Matrix solution composition.
A) Ion images showing the distributions of m/z 2916.6 ± 0.5 (magenta), m/z 2105.2 ± 0.5 (green), and m/z 1501.9 ± 0.5 (orange) or B) m/z 2916.6 ± 0.5 (red), m/z 3252.8 ± 0.5 (green), and m/z 868.5 ± 0.5 (gray) using a matrix solution of 50% acetontrile, 0.1% TFA (left) or 90% acetonitrile, 0.1% TFA (right). C) H&E stained serial section denoting histological features. D) Average spectra from images obtained with 50% acetonitrile, 0.1% TFA (top) or 90% acetonitrile, 0.1% TFA (bottom). Sample preparation: Formalin-fixed paraffin embedded human colon tissues were antigen retrieved, sprayed with trypsin (3.2 ng/mm2, final), and digested overnight in a chamber containing 100 μL of 100 mM ammonium bicarbonate. Samples did not undergo rehydration.

Similar articles

Cited by

References

    1. Norris JL and Caprioli RM. Analysis of tissue specimens by matrix-assisted laser desorption/ionization imaging mass spectrometry in biological and clinical research. Chem. Rev 2013, 113, 2309. - PMC - PubMed
    1. Caprioli RM, Farmer TB, and Gile J. Molecular imaging of biological samples: Localization of peptides and proteins using MALDI-TOF MS. Anal. Chem 1997, 69, 4751. - PubMed
    1. Groseclose MR, Massion PP, Chaurand P, and Caprioli RM. High-throughput proteomic analysis of formalin-fixed paraffin-embedded tissue microarrays using MALDI imaging mass spectrometry. Proteomics 2008, 8, 3715. - PMC - PubMed
    1. Ly A, Buck A, Balluff B, Sun N, Gorzolka K, Feuchtinger A, Janssen K-P, Kuppen PJK, van de Velde CJH, Weirich G, Erlmeier F, Langer R, Aubele M, Zitzelsberger H, McDonnell L, Aichler M, and Walch A. High-mass-resolution MALDI mass spectrometry imaging of metabolites from formalin-fixed paraffin-embedded tissue. Nature Protocols 2016, 11, 1428. - PubMed
    1. Casadonte R and Caprioli RM. Proteomic analysis of formalin-fixed paraffin-embedded tissue by MALDI imaging mass spectrometry. Nat Protoc 2011, 6, 1695. - PMC - PubMed

LinkOut - more resources