. 2019 Jul 23;117(2):281-295.
doi: 10.1016/j.bpj.2019.04.041. Epub 2019 Jun 14.

From Perception Threshold to Ion Channels-A Computational Study

Affiliations

From Perception Threshold to Ion Channels-A Computational Study

Jenny Tigerholm et al. Biophys J. .

Abstract

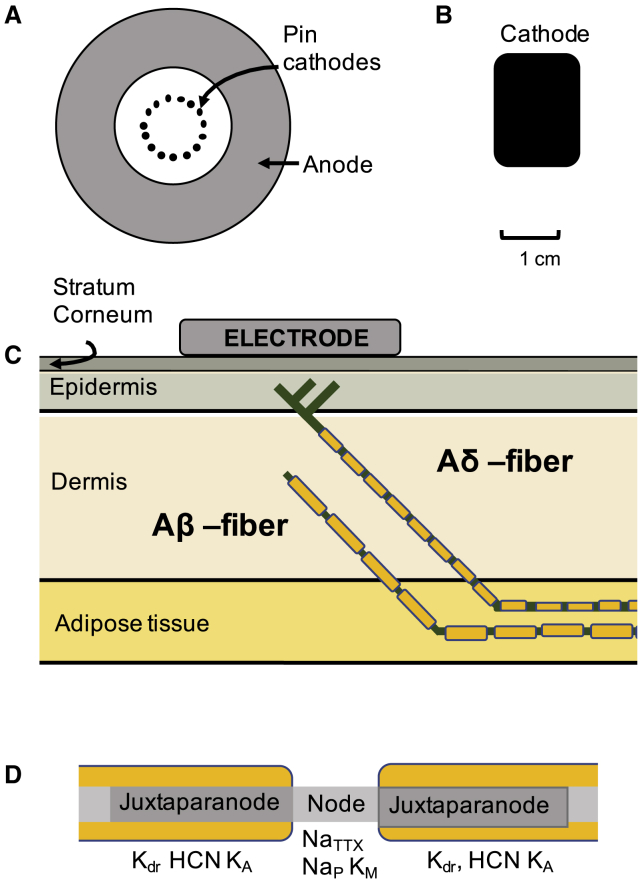
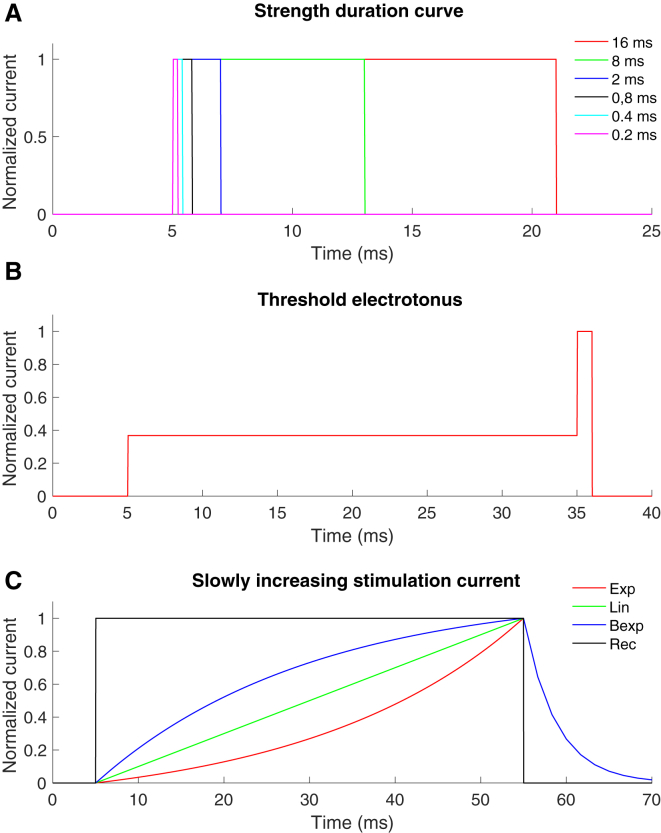
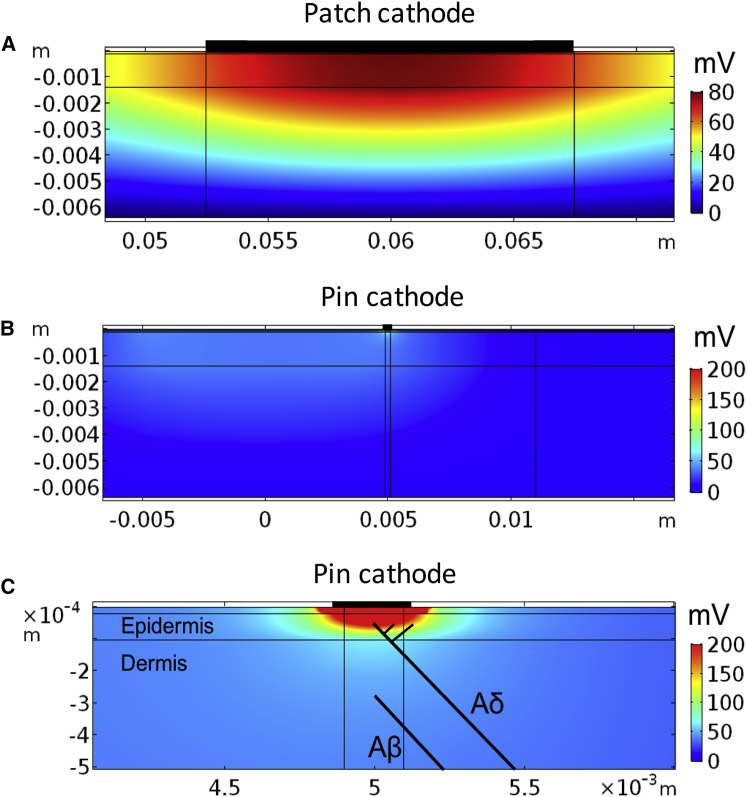
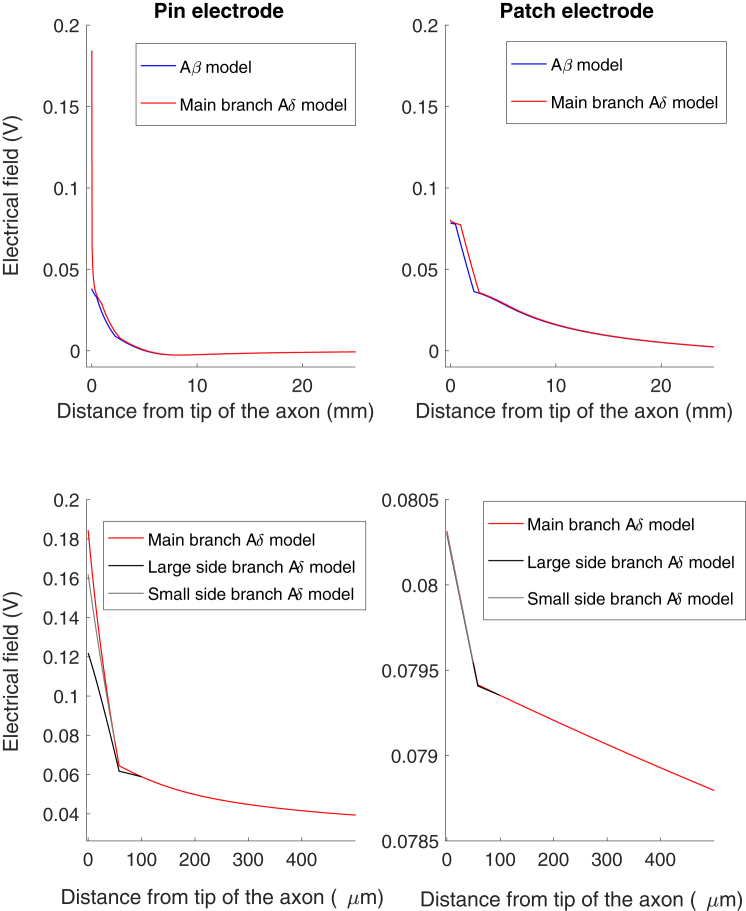
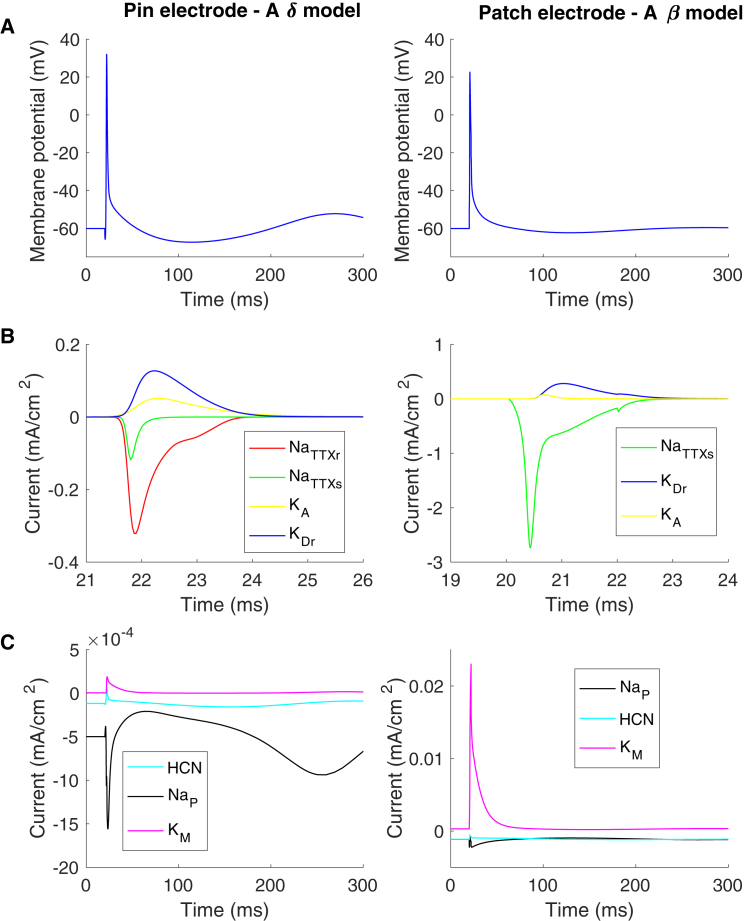
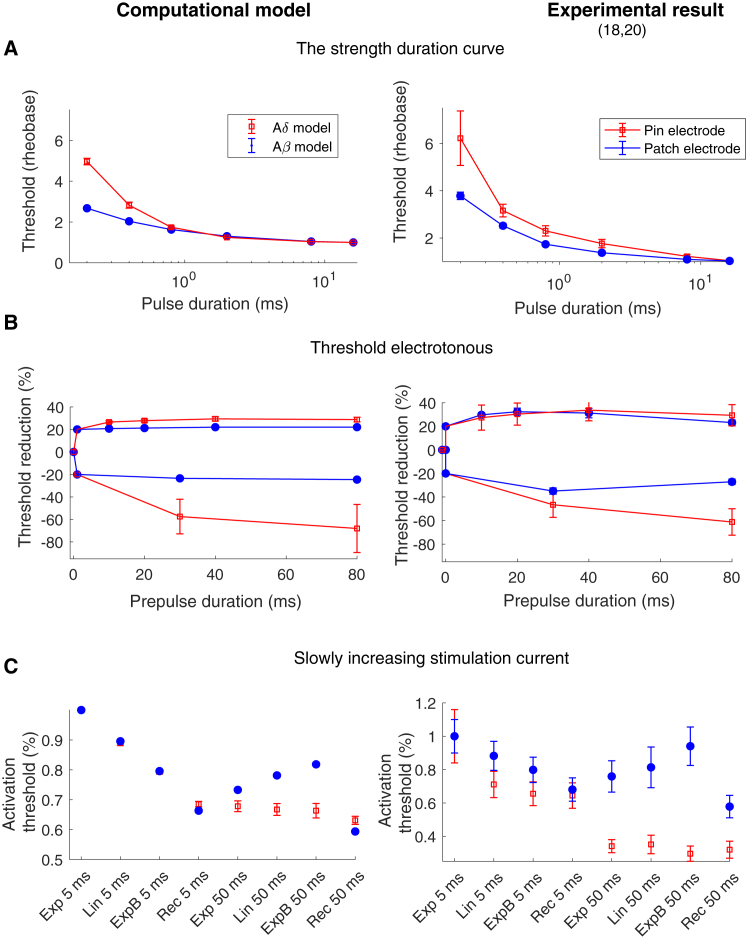
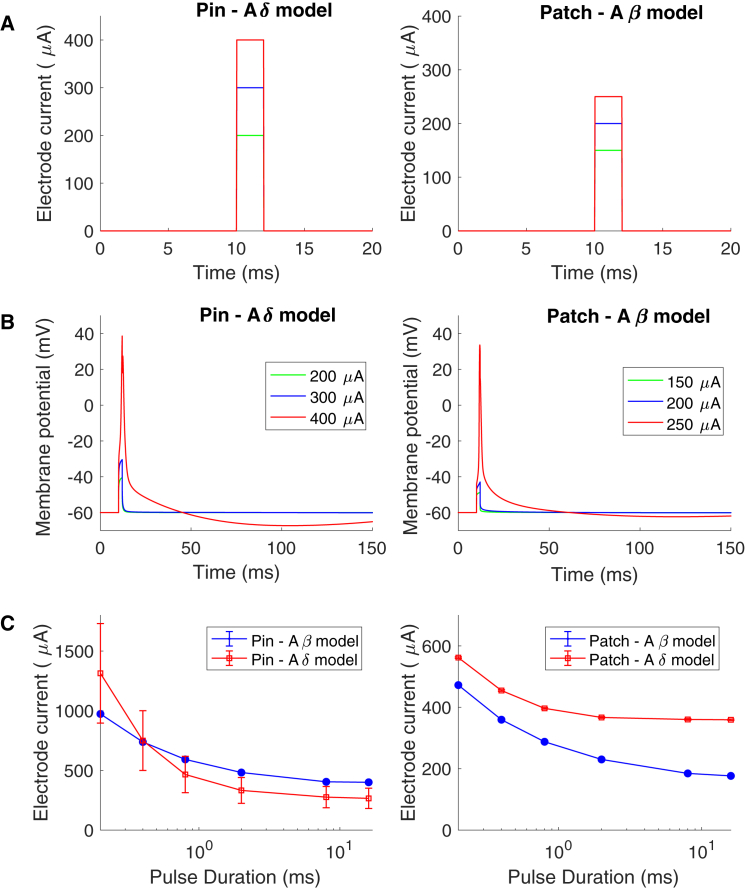
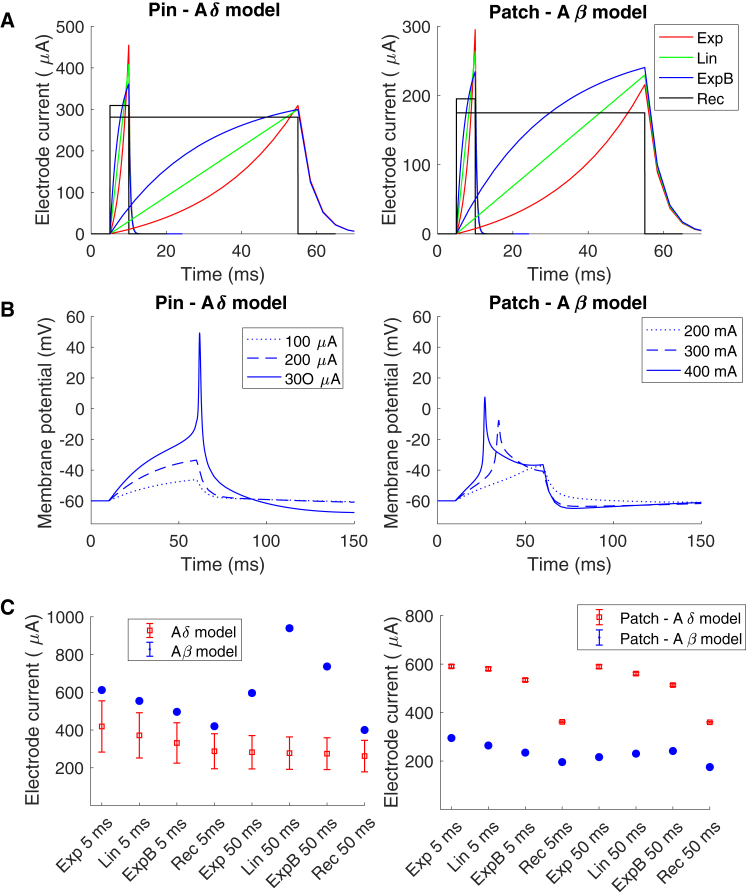
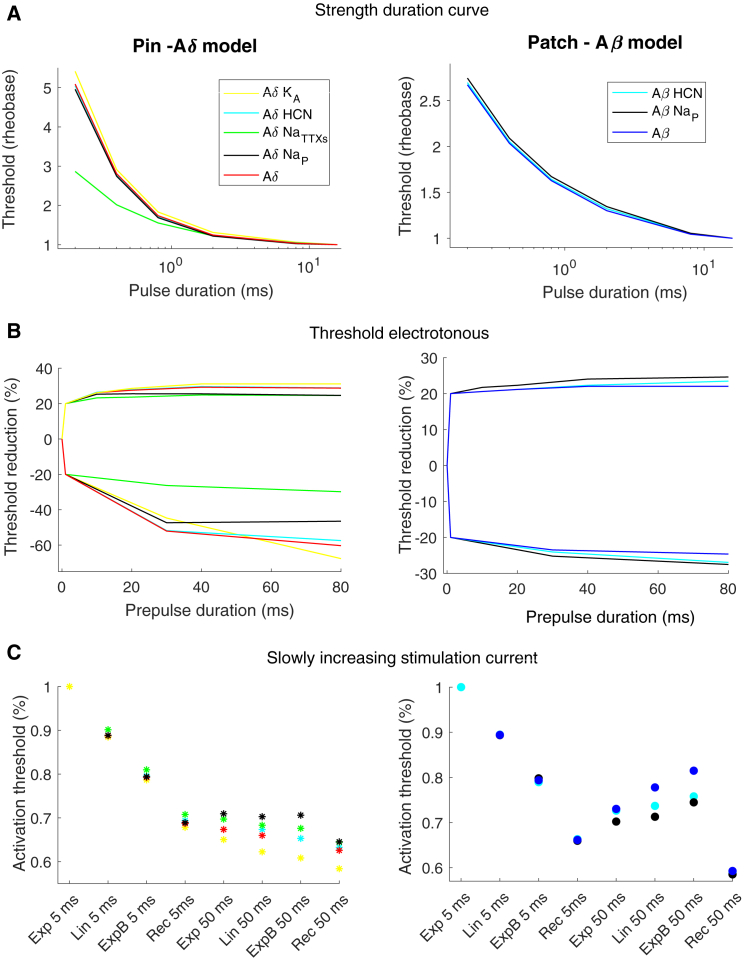
Small-surface-area electrodes have successfully been used to preferentially activate cutaneous nociceptors, unlike conventional large area-electrodes, which preferentially activate large non-nociceptor fibers. Assessments of the strength-duration relationship, threshold electrotonus, and slowly increasing pulse forms have displayed different perception thresholds between large and small surface electrodes, which may indicate different excitability properties of the activated cutaneous nerves. In this study, the origin of the differences in perception thresholds between the two electrodes was investigated. It was hypothesized that different perception thresholds could be explained by the varying distributions of voltage-gated ion channels and by morphological differences between peripheral nerve endings of small and large fibers. A two-part computational model was developed to study activation of peripheral nerve fibers by different cutaneous electrodes. The first part of the model was a finite-element model, which calculated the extracellular field delivered by the cutaneous electrodes. The second part of the model was a detailed multicompartment model of an Aδ-axon as well as an Aβ-axon. The axon models included a wide range of voltage-gated ion channels: NaTTXs, NaTTXr, Nap, Kdr, KM, KA, and HCN channel. The computational model reproduced the experimentally assessed perception thresholds for the three protocols, the strength-duration relationship, the threshold electrotonus, and the slowly increasing pulse forms. The results support the hypothesis that voltage-gated ion channel distributions and morphology differences between small and large fibers were sufficient to explain the difference in perception thresholds between the two electrodes. In conclusion, assessments of perception thresholds using the three protocols may be an indirect measurement of the membrane excitability, and computational models may have the possibility to link voltage-gated ion channel activation to perception threshold measurements.


Figures

Figure 1
Figure 1
Computational model design. A two-part computational model has been developed. The first part of the model calculates the electrical field generated by the two electrodes: a pin electrode (A) or a patch electrode (B). The skin model consists of four rectangular skin layers (C). The second part of the model consists of two axon models (Aδ and Aβ) with the spatial location in the skin model illustrated in (C). The morphology of the myelinated axon sections consists of three parts: node of Ranvier, juxtaparanode, and internode (D). The figures are not drawn to scale. To see this figure in color, go online.
Figure 2
Figure 2
The normalized time-dependent stimulation currents for the three protocols. (A) The six rectangular pulses used for the strength-duration curve are shown. (B) An example of the subthreshold prepulse used during the threshold electrotonus protocol is shown. (C) The four different shapes of slowly increasing stimulation current used for the slowly increasing stimulation current protocol are shown. To see this figure in color, go online.
Figure 3
Figure 3
The electrical field generated by the two electrodes. A constant 1 mA stimulation current was applied through the electrode, and the electrical field was calculated by the finite-element method. (A) The electrical field generated underneath the cathode of the patch electrode is shown. (B) The electrical field generated underneath one of the pin cathodes is shown. (C) Enlargement of the electrical field generated underneath one of the pin cathodes is shown. The spatial locations of the two axon models are illustrated by the two black lines. Note the spatially localized and the large depolarization generated by the pin electrode in epidermis primarily innervated by nociceptive nerve fibers. To see this figure in color, go online.
Figure 4
Figure 4
The electrical field generated by the electrodes along the axons. The figure to the left depicts the pin electrode simulation, and the figure to the right corresponds to the patch electrode stimulation. The figure illustrates the electrical field generated by the two electrodes along the two axon models when a 1 mA continuous pulse was applied through the electrodes. Note the large difference between the electrical fields at the tip of the two axons when the stimulation current was applied through the pin electrode. The lower two figures illustrate the electrical field generated along the branches for the Aδ model. To see this figure in color, go online.
Figure 5
Figure 5
Ion channel currents during an action potential. The figures to the left correspond to the simulation with the pin electrode (Aδ model), and the figures to the right correspond to the simulation with the patch electrode (Aβ model). After a single rectangular-pulse-shaped stimulation current (0.4 mA) with a duration of 2 ms, an action potential was generated. (A) Membrane potential and ionic currents recorded at the tip of the axon for both the Aδ and Aβ models are shown. (B) The large ion channel currents are shown. (C) The small ion channel currents are shown. In the Aβ model, the current density for the potassium current is low for both the KA current and KDr current because the combined area of the juxtaparanode is five times larger than the node of Ranvier. To see this figure in color, go online.
Figure 6
Figure 6
The activation threshold for the three protocols. The figures to the left correspond to the average activation thresholds estimated by the computational models, and the figures to the right correspond to experimental data (the data were given from the authors on request (18, 20)). The activation threshold was defined as the stimulation current needed to generate an action potential that propagated to the end of the axon model. The average activation thresholds for different spatial locations are illustrated in the figure to the right. The error bars represent the SD for the computational results and standard error for the experimental results. For abbreviation descriptions for the pulse shapes (Exp, Lin, ExpB and Rec), see Table 4. To see this figure in color, go online.
Figure 7
Figure 7
The strength-duration curve for the pin and the patch electrode. (A) The stimulation current through the electrodes is shown. (B) The membrane potential corresponding to an extracellular field alteration when applying the current seen in (A) is shown. through the electrode. The nerve fiber model was placed underneath the electrode in the middle of the epidermis (Aδ model) or the dermis (Aβ model). (C) The average current needed to generate an action potential for different spatial location is illustrated in the figure. The error bars represent the SD. To see this figure in color, go online.
Figure 8
Figure 8
The effect of slowly increasing electrical stimulation on the preferential activation of small fibers. (A) The stimulation current needed to generate an action potential for different shapes and durations of slowly increasing stimulation current is shown. (B) The membrane potential corresponding to an extracellular field alteration when applying the electrical current with the ExpB shape is shown (see Table 4). The nerve fiber model was placed underneath the electrode in the middle of the epidermis (Aδ model) or the dermis (Aβ model). (C) The average current needed to generate an action potential for different spatial location is illustrated in the figure. The error bars represent the SD. To see this figure in color, go online.
Figure 9
Figure 9
Varying the ion channel current densities. The figures to the left correspond to the activation thresholds estimates by the computational model for the Aδ model when the pin electrode is activating the nerve model. The activation thresholds were calculated when the fiber model was placed underneath the electrode in the middle of the epidermis (Aδ model) or dermis (Aβ model). For the Aδ model, the NaP and KA currents were reduced to 10% of their original value. The HCN current and the NaTTXs current were increased by factors of 2 and 8, respectively. The figures to the right correspond to the activation thresholds estimated by the computational model for the Aβ model when the patch electrode is activating the nerve model. For the Aβ model, the HCN current was reduced to 10% of its original value, and the NaP density was increased by a factor of 1.5. To see this figure in color, go online.

Similar articles

Cited by

References

    1. Serra J., Bostock H., Quiles C. Microneurographic identification of spontaneous activity in C-nociceptors in neuropathic pain states in humans and rats. Pain. 2012;153:42–55. - PubMed
    1. Yawn B.P., Wollan P.C., Melton L.J., III The prevalence of neuropathic pain: clinical evaluation compared with screening tools in a community population. Pain Med. 2009;10:586–593. - PMC - PubMed
    1. Portenoy R.K., Ugarte C., Haas G. Population-based survey of pain in the United States: differences among white, African American, and Hispanic subjects. J. Pain. 2004;5:317–328. - PubMed
    1. Waxman S.G., Zamponi G.W. Regulating excitability of peripheral afferents: emerging ion channel targets. Nat. Neurosci. 2014;17:153–163. - PubMed
    1. Gold M.S., Shuster M.J., Levine J.D. Characterization of six voltage-gated K+ currents in adult rat sensory neurons. J. Neurophysiol. 1996;75:2629–2646. - PubMed

Publication types