. 2019 Jul 23;117(2):229-238.
doi: 10.1016/j.bpj.2019.06.007. Epub 2019 Jun 14.

Universality and Structural Implications of the Boson Peak in Proteins

Affiliations

Universality and Structural Implications of the Boson Peak in Proteins

Hiroshi Nakagawa et al. Biophys J. .

Abstract

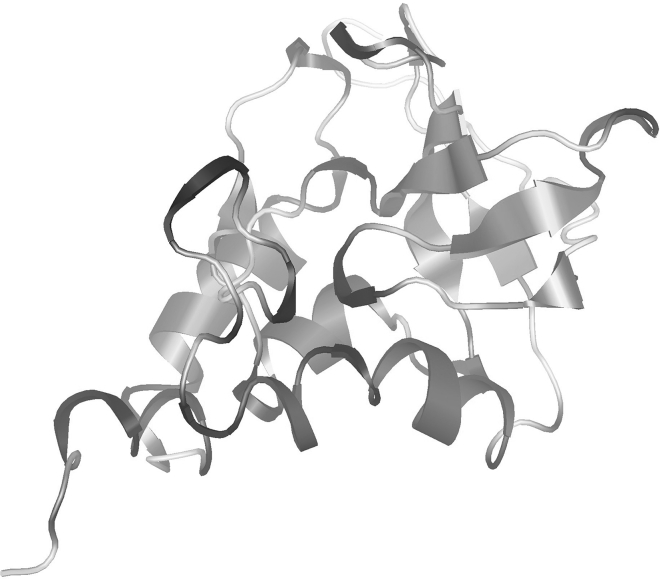
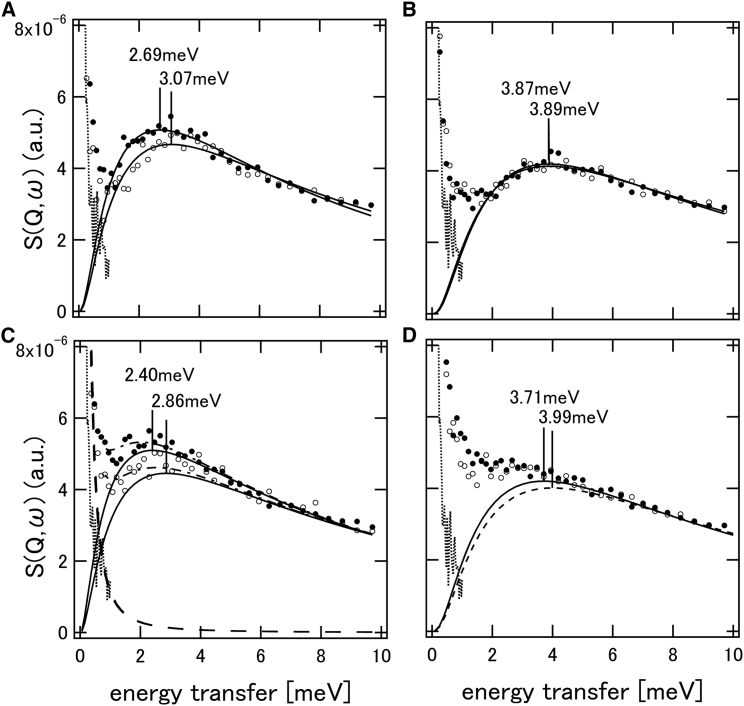
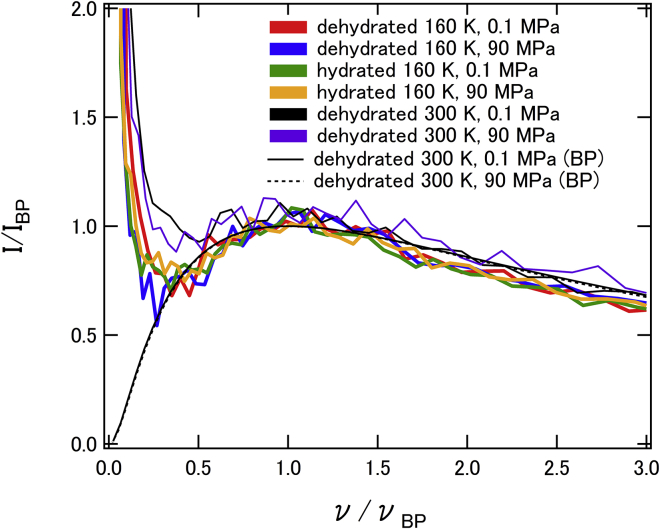
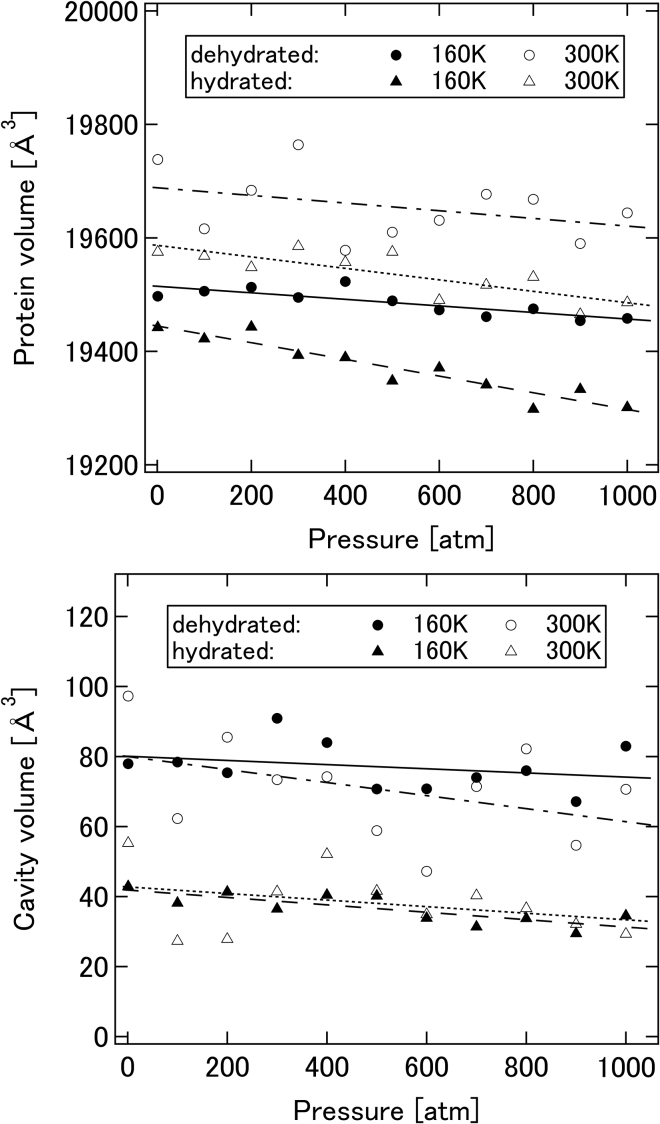
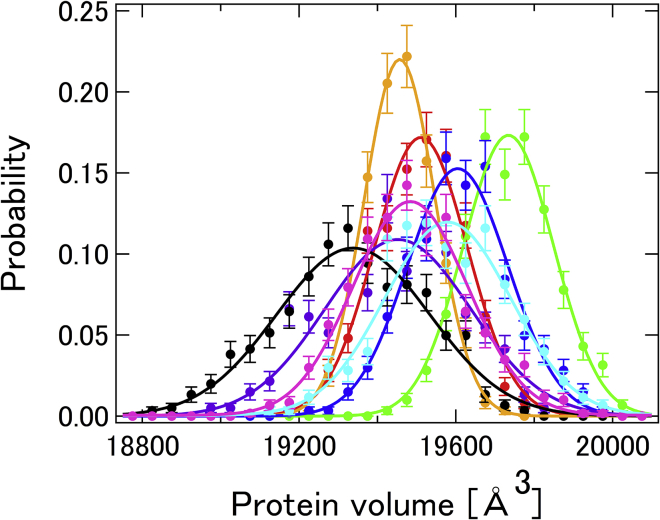
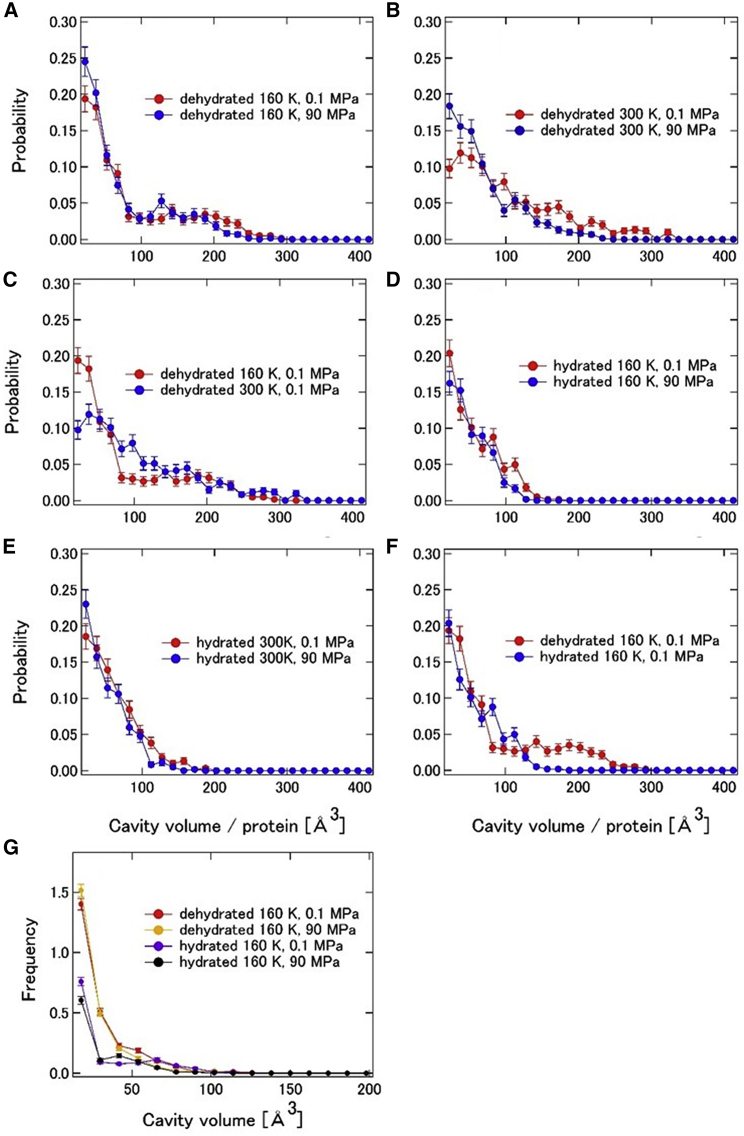
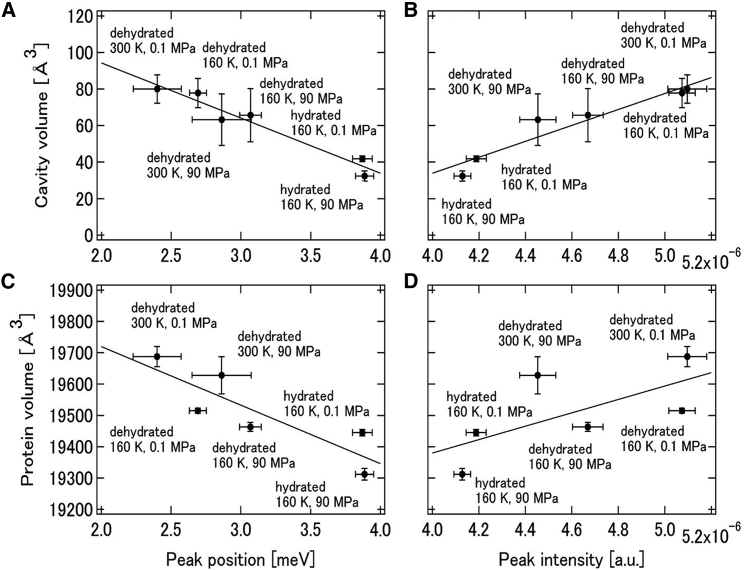
The softness and rigidity of proteins are reflected in the structural dynamics, which are in turn affected by the environment. The characteristic low-frequency vibrational spectrum of a protein, known as boson peak, is an indication of the structural rigidity of the protein at a cryogenic temperature or dehydrated conditions. In this article, the effect of hydration, temperature, and pressure on the boson peak and volumetric properties of a globular protein are evaluated by using inelastic neutron scattering and molecular dynamics simulation. Hydration, pressurization, and cooling shift the boson peak position to higher energy and depress the peak intensity and decreases the protein and cavity volumes. We found the correlation between the boson peak and cavity volume in a protein. A decrease of cavity volume means the increase of rigidity, which is the origin of the boson peak shift. Boson peak is the universal property of a protein, which is rationalized by the correlation.


Figures

Figure 1
Figure 1
Overall conformation of SNase.
Figure 2
Figure 2
Incoherent neutron scattering spectra of SNase at 0.1 (●) and 90 (○) MPa in the (A) dehydrated state at 160 K, (B) hydrated state at 160 K, (C) dehydrated state at 300 K, and (D) hydrated state at 300 K. The solid curves in (AC) correspond to the boson peak fitted by the first term of Eq. 1. The dotted-dash lines in (C) are the curves fitted by Eq. 1, including the quasielstic scattering contribution. The dashed line in (C) is the second term contribution from Eq. 1. The solid and dashed curves in (D) are the boson peak profiles at 0.1 and 90 MPa, respectively, estimated by the correlation in Fig.7, A and B. The dotted curve in each panel is the resolution obtained by vanadium standard measurement.
Figure 3
Figure 3
Universality of the boson peak for various conditions. Each spectrum is normalized by the position and intensity of the boson peak.
Figure 4
Figure 4
Volumetric properties of SNase obtained by molecular dynamics simulation. Shown is the (A) protein volume and (B) total cavity volume for dehydrated state at 160 K (○), hydrated state at 160 K (●), dehydrated state at 300 K (▴), and hydrated state at 300 K (▵).
Figure 5
Figure 5
Distribution of protein volumes of dehydrated state at 160 K and 0.1 MPa (red), dehydrated state at 160 K and 90 MPa (orange), dehydrated state at 300 K and 0.1 MPa (green), dehydrated state at 300 K and 90 MPa (blue), hydrated state at 160 K and 0.1 MPa (purple), hydrated state at 160 K and 90 MPa (black), hydrated state at 300 K and 0.1 MPa (light blue), and hydrated state at 300 K and 90 MPa (pink).
Figure 6
Figure 6
Distributions of total cavity volume over single protein (AF) and individual cavity volume (G). Conditions are given in each panel. The unit of vertical axis in (G) is the frequency distribution per protein.
Figure 7
Figure 7
Correlation between volumetric properties and boson peak. Shown are the correlations between cavity volume and boson peak position (A), cavity volume and boson peak intensity (B), protein volume and boson peak position (C), and protein volume and boson peak intensity (D). The filled and open circles indicate the data at 160 and 300 K, respectively. The solid lines are regression lines. The slopes and intercepts are 154.59 ± 11.7 and −30.2 ± 3.68 (A), −140.64 ± 31.1 and 4.36 ± 0.67 × 107 (B), 2.01 ± 0.02 × 104 and −186.76 ± 56.2 (D), and 1.85 ± 0.06 × 104 and 21.4 ± 11.9 × 107 (D), respectively.

References

    1. Doster W., Cusack S., Petry W. Dynamical transition of myoglobin revealed by inelastic neutron scattering. Nature. 1989;337:754–756. - PubMed
    1. Zaccai G. How soft is a protein? A protein dynamics force constant measured by neutron scattering. Science. 2000;288:1604–1607. - PubMed
    1. Rasmussen B.F., Stock A.M., Petsko G.A. Crystalline ribonuclease A loses function below the dynamical transition at 220 K. Nature. 1992;357:423–424. - PubMed
    1. Cusack S., Doster W. Temperature dependence of the low frequency dynamics of myoglobin. Measurement of the vibrational frequency distribution by inelastic neutron scattering. Biophys. J. 1990;58:243–251. - PMC - PubMed
    1. Doster W., Settles M. Protein-water displacement distributions. Biochim. Biophys. Acta. 2005;1749:173–186. - PubMed

Publication types

Substances

LinkOut - more resources