. 2019 Aug 21;103(4):642-657.e7.
doi: 10.1016/j.neuron.2019.05.044. Epub 2019 Jun 26.

Thrombospondin-1 Mediates Axon Regeneration in Retinal Ganglion Cells

Affiliations

Thrombospondin-1 Mediates Axon Regeneration in Retinal Ganglion Cells

Eric R Bray et al. Neuron. .

Abstract

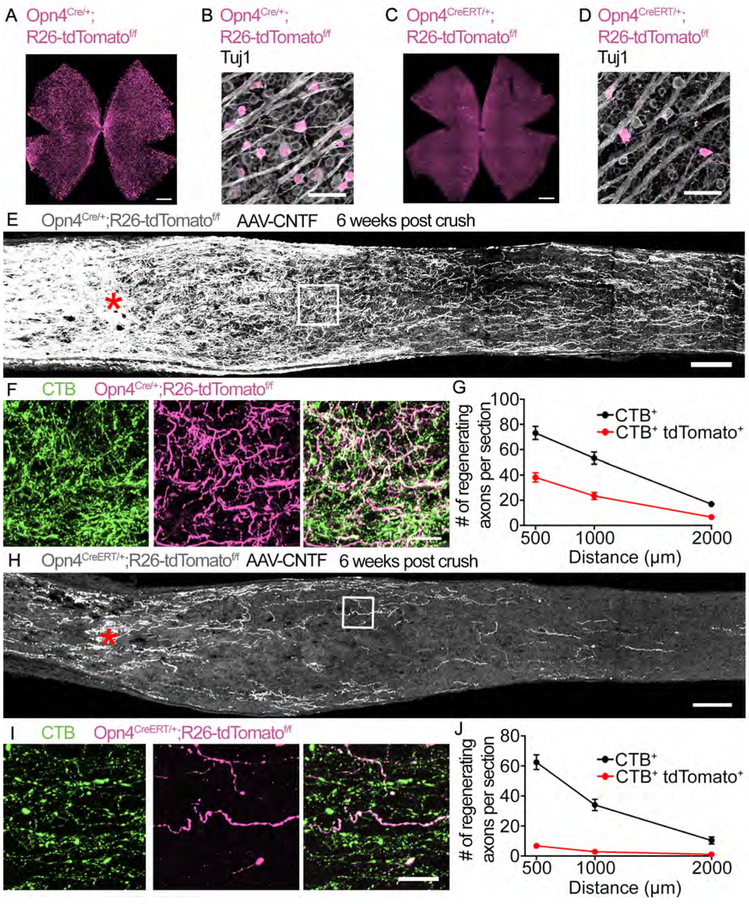
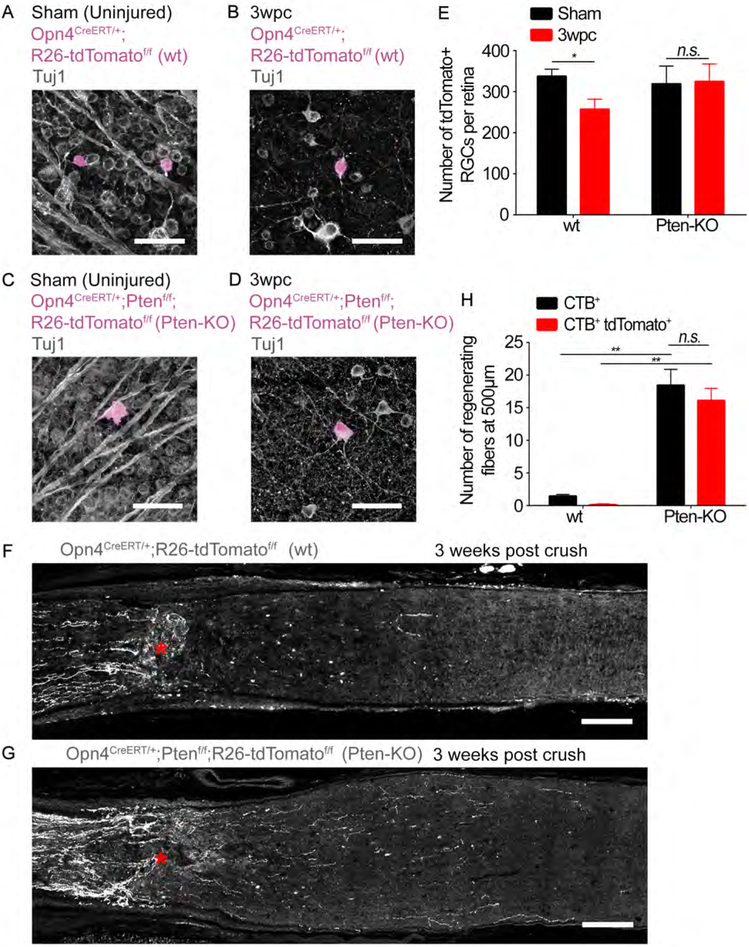
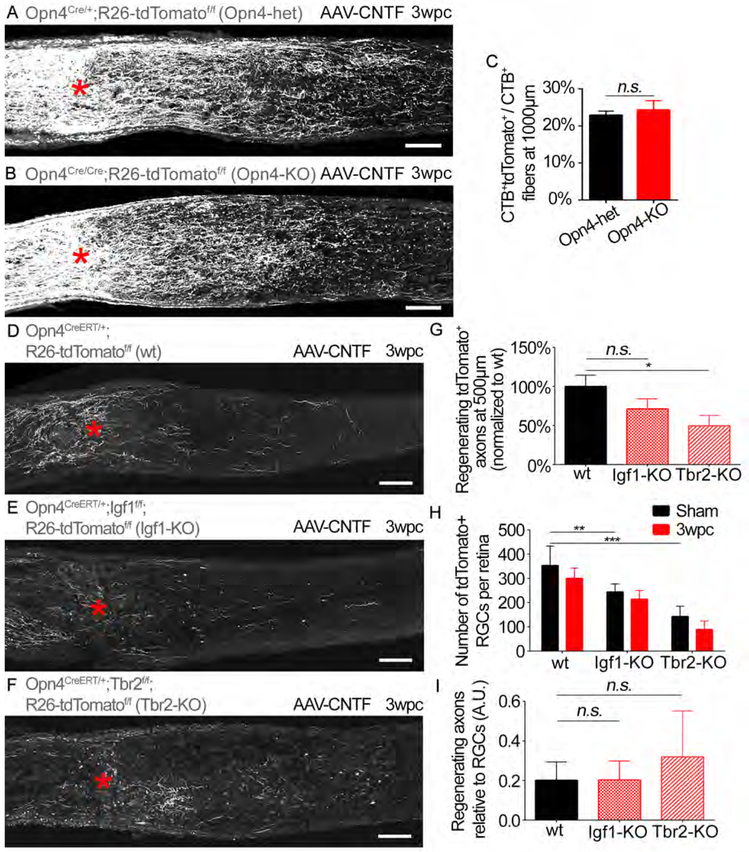
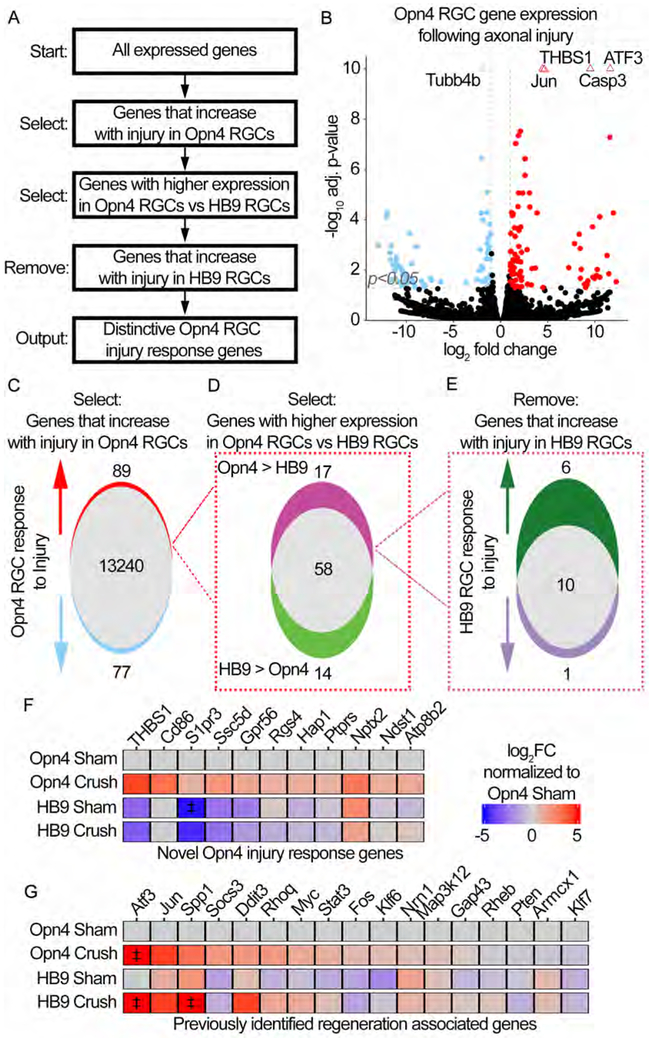
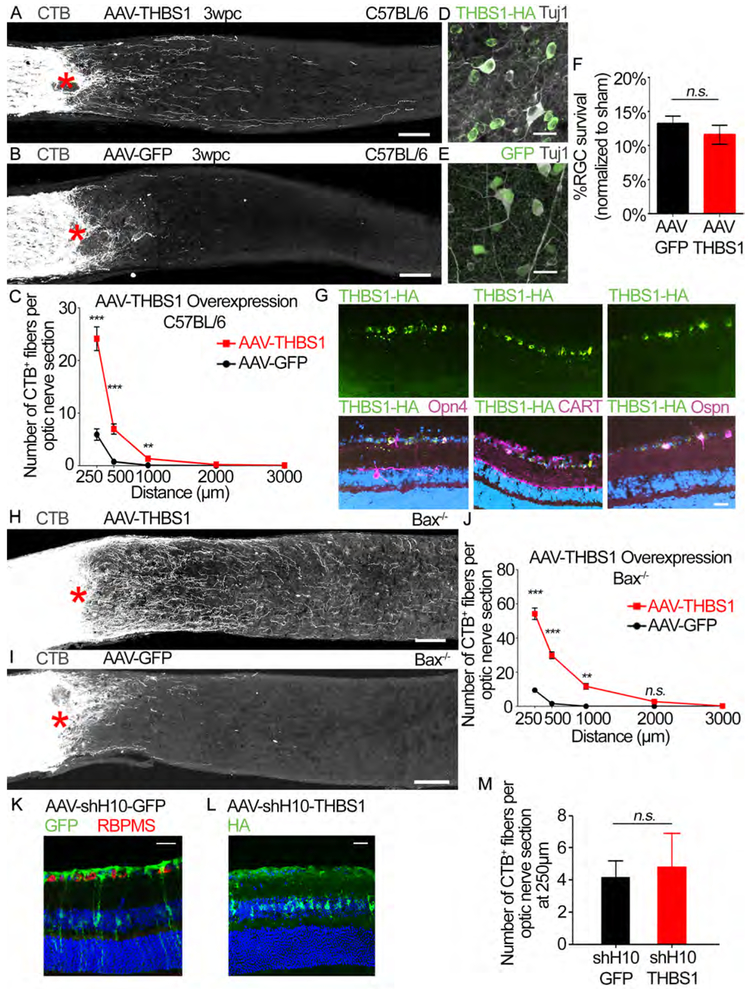
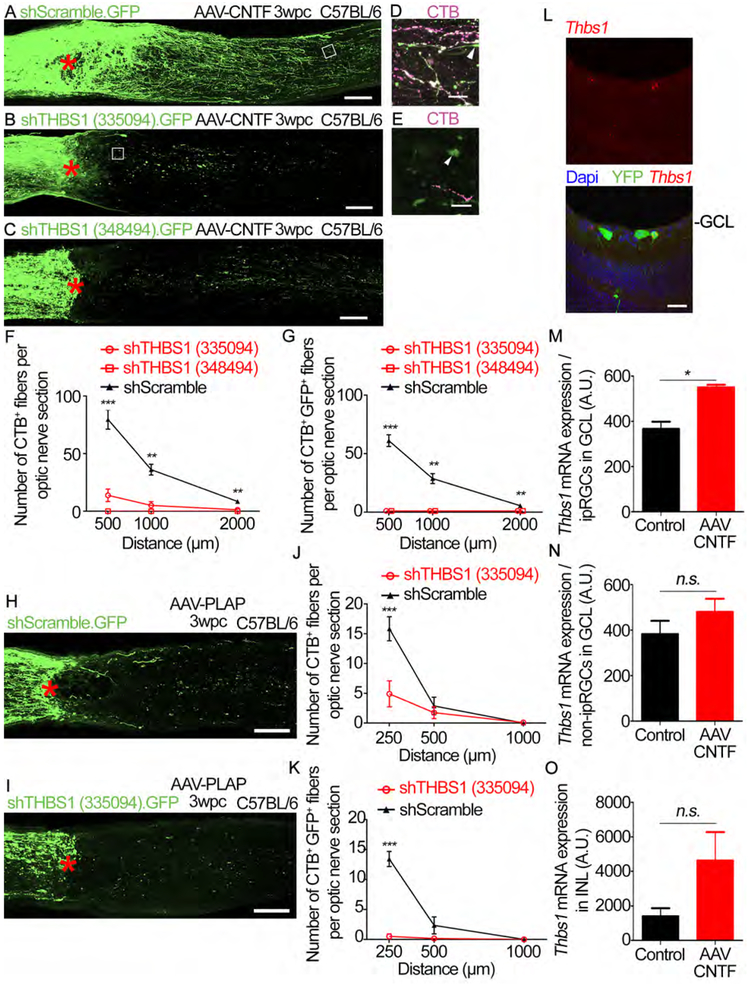
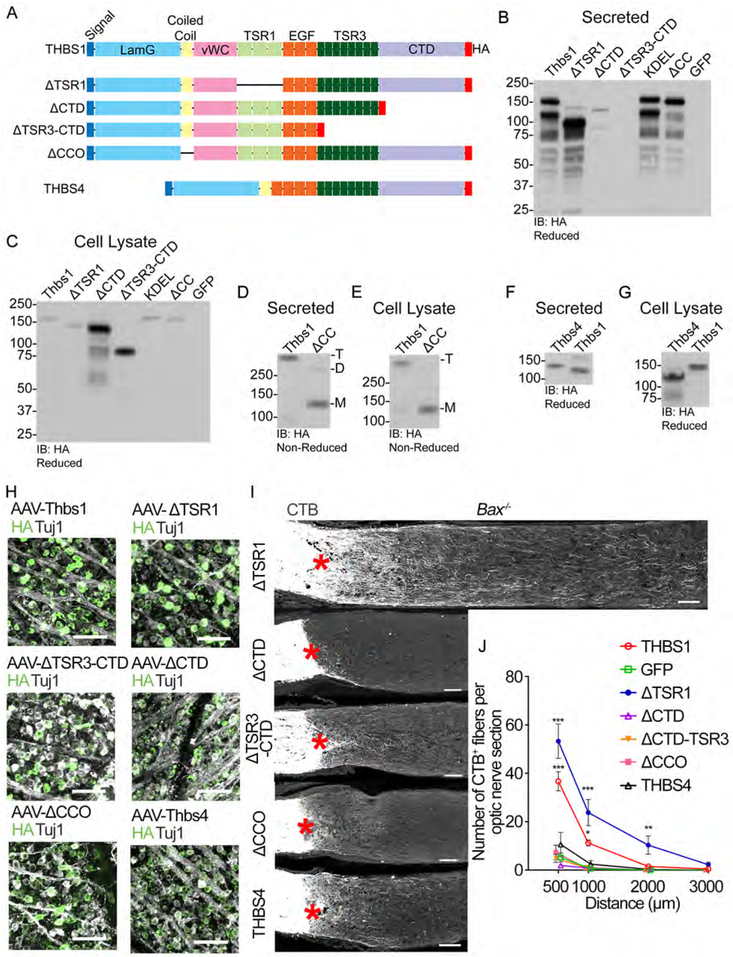
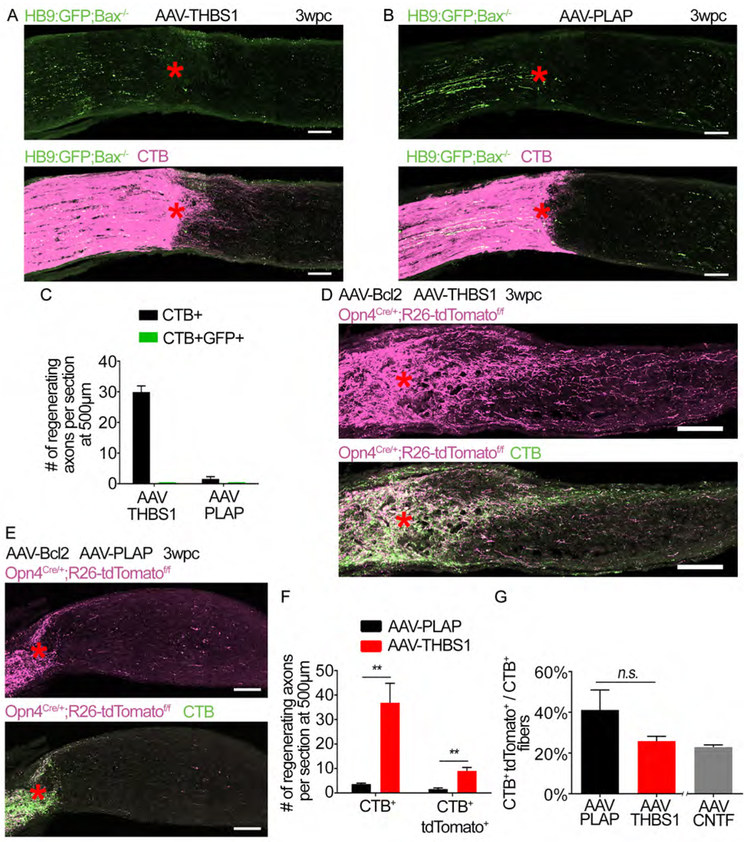
Neuronal subtypes show diverse injury responses, but the molecular underpinnings remain elusive. Using transgenic mice that allow reliable visualization of axonal fate, we demonstrate that intrinsically photosensitive retinal ganglion cells (ipRGCs) are both resilient to cell death and highly regenerative. Using RNA sequencing (RNA-seq), we show genes that are differentially expressed in ipRGCs and that associate with their survival and axon regeneration. Strikingly, thrombospondin-1 (Thbs1) ranked as the most differentially expressed gene, along with the well-documented injury-response genes Atf3 and Jun. THBS1 knockdown in RGCs eliminated axon regeneration. Conversely, RGC overexpression of THBS1 enhanced regeneration in both ipRGCs and non-ipRGCs, an effect that was dependent on syndecan-1, a known THBS1-binding protein. All structural domains of the THBS1 were not equally effective; the trimerization and C-terminal domains promoted regeneration, while the THBS type-1 repeats were dispensable. Our results identify cell-type-specific induction of Thbs1 as a novel gene conferring high regenerative capacity.

Keywords: axon growth; axon injury; axon regeneration; extracellular matrix protein; ipRGCs; melanopsin; retina; retinal ganglion cells; syndecan; thrombospondin.


Conflict of interest statement

The authors declare no conflict of interest.

Figures

Figure 1:
Figure 1:. ipRGCs are capable of robust axon regeneration.
(A) Whole mount staining of an Opn4Cre/+;R26-tdTomatof/f retina for tdTomato (magenta). (B) Higher magnification image showing colocalization of tdTomato+ RGCs with the pan neuronal marker Tuj1 (grey) in an Opn4Cre/+;R26-tdTomatof/f retina (C) Whole mount staining of an Opn4CreERT/+;R26-tdTomatof/f retina for tdTomato. (D) Higher magnification image showing colocalization of tdTomato+ RGCs with Tuj1 in an Opn4CreERT/+;R26-tdT omatof/f retina. (E) Image of the optic nerve from Opn4Cre/+;R26-tdTomatof/f mice showing tdTomato (grey) labeled axons 6 weeks post crush. AAV-CNTF was injected intravitreally. Asterisks, lesion site. (F) High-magnification images of the boxed area in (E), CTB (green), tdTomato (magenta), and merged image. (G) Quantification of axon regeneration for (E). The average number of CTB+ and CTB+ tdTomato+ axons in Opn4Cre/+;R26-tdTomatof/f mice observed in each optic nerve section. (H) Image of the optic nerve from Opn4CreERT/+;R26-tdTomatof/f mice showing tdTomato (grey) labeled axons 6 weeks post crush. AAV-CNTF was injected intravitreally. (I) High-magnification images of the boxed area in (H), CTB (green), tdTomato (magenta), and merged image. (J) Quantification axon regeneration for (H). The average number of CTB+ and CTB+ tdTomato+ axons in Opn4CreERT/+;R26-tdTomatof/f mice observed in each optic nerve section. n = 8 Opn4Cre/+;R26-tdTomatcff/f n = 7 Opn4CreERT/+;R26-tdTomatdf/f. wpc, weeks post crush. Error bars, SEM. Scale bars, 500 μm (A, C), 50 μm (B, D), 100 μm (E, H), 20 μm (F, I).
Figure 2:
Figure 2:. PTEN knockout promotes the regeneration of Opn4CreERT/+;R26-tdTomatof/f axons following optic nerve crush.
(A-D) Images of retinal whole mounts showing Tuj1-labeled RGCs (grey) and tdTomato-labeled ipRGCs (magenta). (A and B) Opn4CreERT/+;R26-tdTomatof/f (wt) or (C and D) Opn4CreERT/+;Ptenf/f;R26-tdTomatof/f (Pten-KO). (A and C) Sham uninjured (i.e. sham surgery only). (B and D) 3 weeks post crush. Scale bars, 50 μm. (E) Quantification of RGC survival for (A-D). The number of tdTomato-labeled RGCs per retina in each condition. * p < 0.05, n.s. p0.05, t-test 3wpc vs Sham for each group. Error bars, SEM. n =3 per group. (G and H) Representative images of optic nerve sections showing tdTomato-labeled axons (grey) from (G) Opn4CreERT/+;R26-tdTomatof/f or (H) Opn4CreERT/+;Ptenf/f;R26-tdTomatof/f mice 3 weeks following crush. Lesion site marked by asterisks. Scale bars, 100 μm. (F) Quantification of axon regeneration for (G and H). The number of CTB+ and CTB+ tdTomato+ axons at 500 μm distal to the lesion site. ** p<0.01, n.s. p>0.05 ANOVA with Tukey’s post-hoc. Error bars, SEM. n = 3 Opn4CreERT/+;Ptenf/f;R26-tdTomatdf/f, n = 4 Opn4CreERT/+;R26-tdTomatdf/f.
Figure 3:
Figure 3:. Assessing the effects of deleting known ipRGC signature genes on ipRGC survival and axon regeneration.
(A and B) Optic nerves from (A) Opn4Cre/+;R26-tdTomatof/f (Opn4-het) and (B) Opn4Cre/Cre;R26-tdTomatof/f (Opn4-KO) mice showing tdTomato (grey) labeled axons 3 weeks post crush. Asterisks, lesion site. Animals received AAV-CNTF injection. Scale bars, 100 μm. (C) Quantification of axon regeneration for (A and B). Average number of CTB+ tdTomato+ axons per nerve section normalized to total CTB+ axons. t-test n.s. p>0.05. n=5 per condition. (D-F) Optic nerves from (D) Opn4CreERT/+;R26-tdTomatof/f (wt), (E) Opn4CreERT/+;Igf1f/f;R26-tdTomatof/f (Igf1-KO), and (F) Opn4CreERT/+;Tbr2f/f;R26-tdTomatof/f (Tbr2-KO) mice showing tdTomato (grey) labeled axons. Scale bars, 100 μm. (G) Quantification of axon regeneration for (D-F). Average number of CTB+ tdTomato+ axons per nerve section in each condition (i.e. wt, Igf1 KO and Tbr2 KO). ANOVA with Bonferroni’s post-hoc vs wt. * p0.05. (H) Average number of tdTomato+ RGCs in the injured retina (“3wpc”) and uninjured retina contralateral to the injured side (i.e. “sham” surgery only) for each condition (i.e. wt, Igf1 KO and Tbr2 KO). ANOVA with Bonferroni’s post-hoc vs wt-sham. ** p0.01, *** p0.001. (I) Axon regeneration relative to the number of surviving RGCs. ANOVA with Bonferroni’s post-hoc vs wt. n.s. p>0.05. (D-I) n=8 wt, n=6 Igf1-KO, n=7 Tbr2-KO. wpc, weeks post crush. A.U., arbitrary unit (axon/RGCs). Error bars, SEM.
Figure 4:
Figure 4:. RNA-seq of regeneration competent ipRGCs reveals the expression of novel injury response genes.
(A) Multiple comparison methodology used to determine unique ipRGC injury response genes. (B) Volcano plot showing differential gene expression in Opn4 RGCs following crush. Positive log2FC indicates an increase in Crush relative to Sham. Genes are considered significantly different if expression ±1 log2FC and adjusted (adj) p-value0.05, vertical and horizontal reference lines at respective values. Triangles indicate genes with an adj p-value≤1*10−10, these values were fixed at 1*10−10. (C) Venn-diagram representation of (B). 89 genes are upregulated following crush in Opn4 RGCs. (D) Venn-diagram dividing the 89 genes from (C) based on the relative expression in injured Opn4 vs HB9 RGCs. 17 of the 89 genes are enriched in Opn4 RGCs. (E) Venn-diagram dividing the 17 genes from (D) based on the expression change in HB9 RGCs following crush. (F-G) Heatmaps showing the expression of indicated genes. Expression is presented as the log2FC relative to Sham Opn4 RGCs. ‡ indicates values that exceeded ±5 log2FC and were fixed at ±5 log2FC. (F) Heatmap of the 11 genes identified to be novel Opn4 injury response genes. (G) Heatmap of previously reported regeneration associated genes (RAGs).
Figure 5:
Figure 5:. Ectopic THBS1 expression promotes RGC axon regeneration.
(A and B) Images of optic nerve sections showing CTB-labeled axons (grey) in C57BL/6J mice injected with either (A) AAV-THBS1 or (B) AAV-GFP. Asterisks, lesion site. Scale bars, 100 μm. (C) Quantification of axon regeneration for (A and B). Average number of CTB+ fibers per optic nerve section at indicated distances from the lesion. n=10 per condition (D and E) Representative retina whole-mount images showing Tuj1+ (grey) and (D) THBS1-HA (green) or (E) GFP labeled cells in C57BL/6J mice shown in (A and B). Scale bars, 25 μm. (F) Quantification of RGC survival for (D-E). Average % survival of RGCs (Tuj1+ RGCs) in injured retina normalized to uninjured (sham) retina. n=10 per condition. (G) Representative retinal sections from AAV-THBS1-HA injected mouse stained with antibodies against HA (green) and indicated RGC subtype markers (magenta; Opn4, CART and Ospn which are markers of ipRGCs, DSGCs and alpha RGCs, respectively). Dapi in blue. Scale bar, 25 μm. (H and I) Images of optic nerve sections showing CTB-labeled axons (grey) in Bax−/− mice injected with either (H) AAV-THBS1 or (I) AAV-GFP. Asterisks, lesion site. Scale bars, 100 μm. (J) Quantification of axon regeneration for (H and I). Average number of CTB+ fibers per optic nerve section at difference distances from lesion site. n=5 per condition. (K) Representative retinal section from AAV-shHIO-GFP injected mouse stained with GFP (green) and RBPMS (RNA-Binding Protein With Multiple Splicing, a RGC marker; red) antibodies. Dapi in blue. Note that GFP expression is predominantly in non-RGCs. Scale bar, 25 μm. (L) Representative retinal section from AAV-shH10-THBS1-HA injected mouse stained with HA antibody. Dapi in blue. Scale bar, 25 μm. (M) Quantification of axon regeneration for the AAV-shH10 animals in (K and L). Average number of CTB+ fibers per optic nerve section at 250 μm from the lesion site. n=6 for AAV-shH10-GFP and 7 for AAV-shH10-THBS1. Statistics, (C, and J) Unpaired t-test, 2 tailed, at each distance; (F and M) Unpaired t-test, 2 tailed, n.s. p>0.05, *p0.05, **p0.01, ***p0.001, Error bars, SEM.
Figure 6:
Figure 6:. THBS1 expression is required for RGC axon regeneration.
(A) An image of optic nerve section showing GFP-labeled axons (green) in mice co-injected with AAV-CNTF and AAV-shScramble.GFP. Asterisk, lesion site. (B) An image of optic nerve section showing GFP-labeled axons in mice co-injected with AAV-CNTF and AAV-shTHBS1 (335094). GFP. (C) An image of optic nerve section showing GFP-labeled axons in mice co-injected with AAV-CNTF and AAV-shTHBS (348494). GFP. (D) Higher magnification of the boxed region in (A). CTB (magenta), GFP (green). (E) Higher magnification of the boxed region in (B). CTB (magenta). GFP (green). (F) Quantification of axon regeneration for (A-E). Average number of CTB+ fibers per optic nerve section at various distances from the lesion site. (G) Quantification of axon regeneration for (A-E). Average number of CTB+ GFP+ fibers per optic nerve section at various distances from the lesion site. (H) An image of optic nerve section showing GFP-labeled axons (green) in mice co-injected with AAV-PLAP and AAV-shScramble.GFP. (I) An image of optic nerve section showing GFP-labeled axons (green) in mice co-injected with AAV-PLAP and AAV-shTHBS1(335094).GFP. (J) Quantification of axon regeneration for (H and I). Average number of CTB+ fibers per optic nerve section at various distances from the lesion site. (K) Quantification of axon regeneration for (H and I). Average number of CTB+ GFP+ fibers per optic nerve section at various distances from the lesion site. (L) Representative retinal section from an AAV-CNTF injected Opn4Cre/+;Rosa26-YFPf/f mouse. Fluorescent in situ hybridization (FISH) was performed on retina sections 3 days post-crush. Thbs1 mRNA (red), YFP protein expression, Dapi in blue. GCL, ganglion cell layer. Scale bar, 25 μm. (M) Quantification of Thbs1 mRNA expression in ipRGCs (i.e. YFP+RGCs) in AAV-CNTF-treated or animals without AAV injection (“Control”) presented as fluorescent signal intensity. A.U., arbitrary unit. (N) Quantification of Thbs1 mRNA expression in non-ipRGCs (i.e. YFP RGCs) in the ganglion cell layer of AAV-CNTF-treated or animals without AAV injection (“Control”) presented as fluorescent signal intensity. (O) Quantification of Thbs1 mRNA expression in the inner nuclear layer (INL) in AAV-CNTF-treated or animals without AAV injection (“Control”) presented as fluorescent signal intensity. Statistics, (F and G) ANOVA with Bonferroni’spost-hoc vs shScramble; (JandK) Unpaired t-test; n=5 per condition. (M-O) Unpairedt-test, n=2 per condition. * p0.05, ** p0.01, *** p0.001. Error bars, SEM. Scale bars, 100 μm (A-C, H and I), 25 μm (D, E and L).
Figure 7:
Figure 7:. THBS1’s regenerative effects require trimerization and CTD, but not TSR1 domains.
(A) A schematic of THBS1 mutants investigated. All constructs contain the N-terminal signal peptide and have a C-terminal HA tag. Laminin G domain (LamG), oligomerization coiled coil (CC) domain, von Willebrand complex like domain (vWC), thrombospondin type 1 repeat domain (TSR1), epidermal growth factor-like repeat domains (EGF), type 3 repeat domain (TSR3), and the thrombospondin C-terminal domain (CTD). THBS4 is shown for comparison to THBS1. (B-E) Validation of THBS1 constructs. Wild-type and mutant THBS1 vectors were expressed in HEK293T cells. All blots are immunoblotted (IB) for HA. (B and D) Secreted proteins from conditioned media. (C and E) Proteins from cell lysate. (B and C) Expression of THBS1, THBS1-ΔTSR1, THBS1-ΔCTD, THBS1-ΔTSR3-CTD, THBS1-KDEL, THBS1ΔCC, and GFP. Proteins reduced with DTT. THBS1-KDEL (nuclear exclusion sequence) was included to see if this form retains THBS1 expression inside the cells (refer to Discussion). (D and E) THBS1 and THBS1ΔCC were blotted under non-reducing conditions to validate oligomerization. Predicted oligomerization: M: monomeric, D: dimeric, and T: trimeric. (F and G) Size validation of THBS4 construct. (F) Secreted proteins from conditioned media. (G) Proteins from cell lysate. (H) Representative retinal whole mount images from mice injected with AAVs expressing various THBS forms stained for HA (green) and Tuj1 (grey). Scale bars, 100 μm. (I) Images of optic nerve sections showing CTB-labeled axons (grey) in mice injected with AAV-THBS1ΔTSR1, AAV- THBS1ΔCTD, AAV- THBS1ΔTSR3-CTD, AAV- THBS1ΔCC or AAV-THBS4. Asterisks, lesion site. Scale bars, 100 μm. (J) Quantification of axon regeneration for (I). Average number of CTB+ fibers per optic nerve section. ANOVA with Bonferroni’s post-hoc vs AAV-GFP, * p0.05, ** p0.01, *** p<0.001. n=5 for AAV-GFP, AAV-THBS1, AAV-THBS1ΔCTD, and AAV-THBS4, 4 for AAV-THBS1ΔTSR1, AAV-THBS1ΔTSR3-CTD, and AAV-THBS1ΔCC. Error bars, SEM.
Figure 8:
Figure 8:. Ectopic overexpression of THBS1 promotes regeneration in ipRGCs as well as non-ipRGCs.
(A) Images of optic nerve section showing GFP-labeled axons (green) from HB9:GFP;Bax−/− mice and CTB (magenta) following injection with AAV-THBS1 and optic nerve crush. Asterisks, lesion site. (B) Images of optic nerve section showing GFP-labeled axons (green) from HB9:GFP;Bax−/− mice and CTB (magenta) following injection AAV-PLAP. Asterisks, lesion site. (C) Quantification of axon regeneration for (A and B). The number of CTB+ and CTB+ GFP+ axons at 500 μm distal to the lesion site. n=3 per condition. Error bars, SEM. (D) Images of optic nerve section showing tdTomato (magenta) labeled axons from Opn4Cre/+;R26-tdTomatof/f mice and CTB in green. Mice were co-injected with AAV-Bcl2 and AAV-THBS1. Asterisks, lesion site. (E) Images of optic nerve section showing tdTomato (magenta) labeled axons from Opn4Cre/+;R26-tdTomatof/f mice and CTB in green. Mice were co-injected with AAV-Bcl2 and AAV-PLAP. Asterisks, lesion site. (F) Quantification of axon regeneration for (D and E). Average number of CTB+ and CTB+ tdTomato+ axons per optic nerve at 500 μm distal to the lesion site. (G) Percentage of CTB+ tdTomato+ relative to CTB+ axons in each condition. An “AAV-CNTF” bar from Figure 3C (i.e. Opn4Cre/+;R26-tdTomatof/f mice treated with AAV-CNTF) is included as a comparison to AAV-THBS1 treatment. Statistics in (F and G), t-test n.s. p>0.05, ** p0.01, n=3 for AAV-THBS1, 4 for AAV-PLAP. Scale bars, 100 μm. Error bars, SEM.

References

    1. Adams JC, Kureishy N, and Taylor AL (2001). A role for syndecan-1 in coupling fascin spike formation by thrombospondin-1. J Cell Biol 152, 1169–1182. - PMC - PubMed
    1. Adams JC, and Lawler J (2004). The thrombospondins. Int J Biochem Cell Biol 36, 961–968. - PMC - PubMed
    1. Anilkumar N, Annis DS, Mosher DF, and Adams JC (2002). Trimeric assembly of the C-terminal region of thrombospondin-1 or thrombospondin-2 is necessary for cell spreading and fascin spike organisation. J Cell Sci 115, 2357–2366. - PubMed
    1. Bray ER, Noga M, Thakor K, Wang Y, Lemmon VP, Park KK, and Tsoulfas P (2017). 3D Visualization of Individual Regenerating Retinal Ganglion Cell Axons Reveals Surprisingly Complex Growth Paths. eNeuro 4. - PMC - PubMed
    1. Cafferty WB, McGee AW, and Strittmatter SM (2008). Axonal growth therapeutics: regeneration or sprouting or plasticity? Trends Neurosci 31, 215–220. - PMC - PubMed

Publication types

MeSH terms