Observational Study
. 2019 Oct;157(4):1109-1122.
doi: 10.1053/j.gastro.2019.06.028. Epub 2019 Jun 27.

Microbiome Signatures Associated With Steatohepatitis and Moderate to Severe Fibrosis in Children With Nonalcoholic Fatty Liver Disease

Affiliations
Observational Study

Microbiome Signatures Associated With Steatohepatitis and Moderate to Severe Fibrosis in Children With Nonalcoholic Fatty Liver Disease

Jeffrey B Schwimmer et al. Gastroenterology. 2019 Oct.

Abstract

Background & aims: The intestinal microbiome might affect the development and severity of nonalcoholic fatty liver disease (NAFLD). We analyzed microbiomes of children with and without NAFLD.

Methods: We performed a prospective, observational, cross-sectional study of 87 children (age range, 8-17 years) with biopsy-proven NAFLD and 37 children with obesity without NAFLD (controls). Fecal samples were collected and microbiome composition and functions were assessed using 16S ribosomal RNA amplicon sequencing and metagenomic shotgun sequencing. Microbial taxa were identified using zero-inflated negative binomial modeling. Genes contributing to bacterial pathways were identified using gene set enrichment analysis.

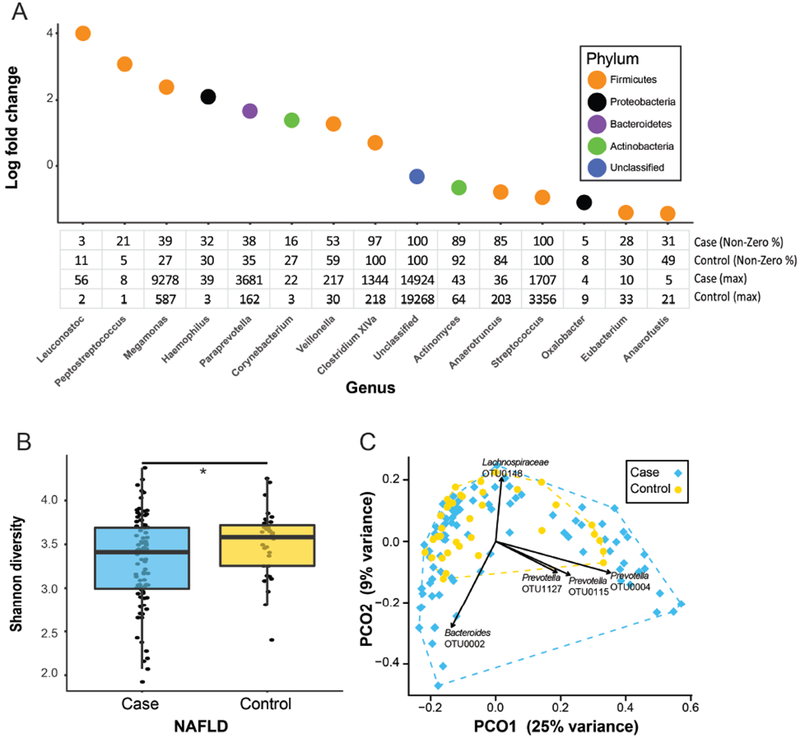
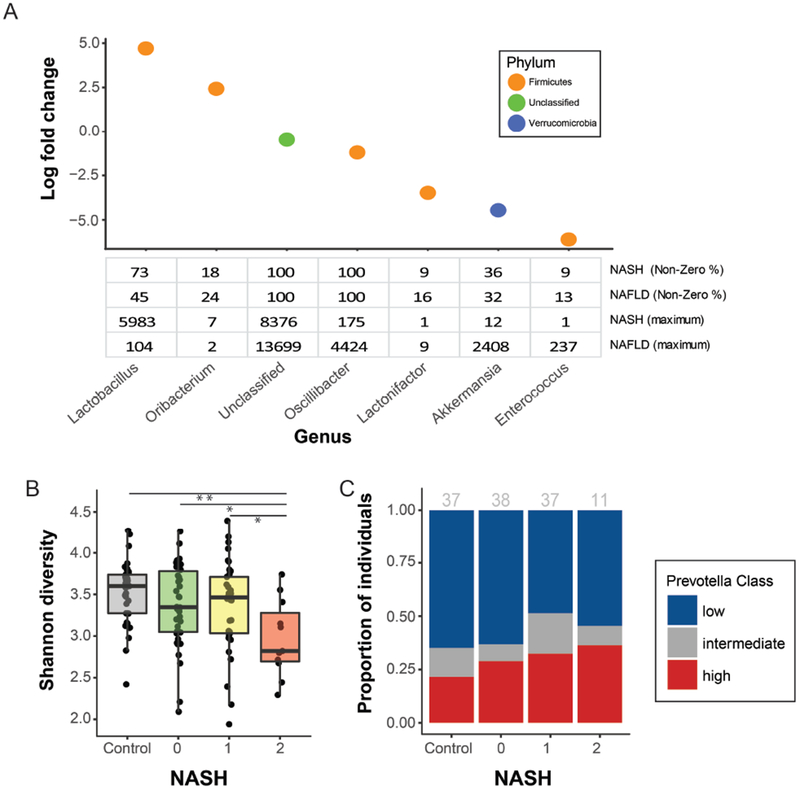
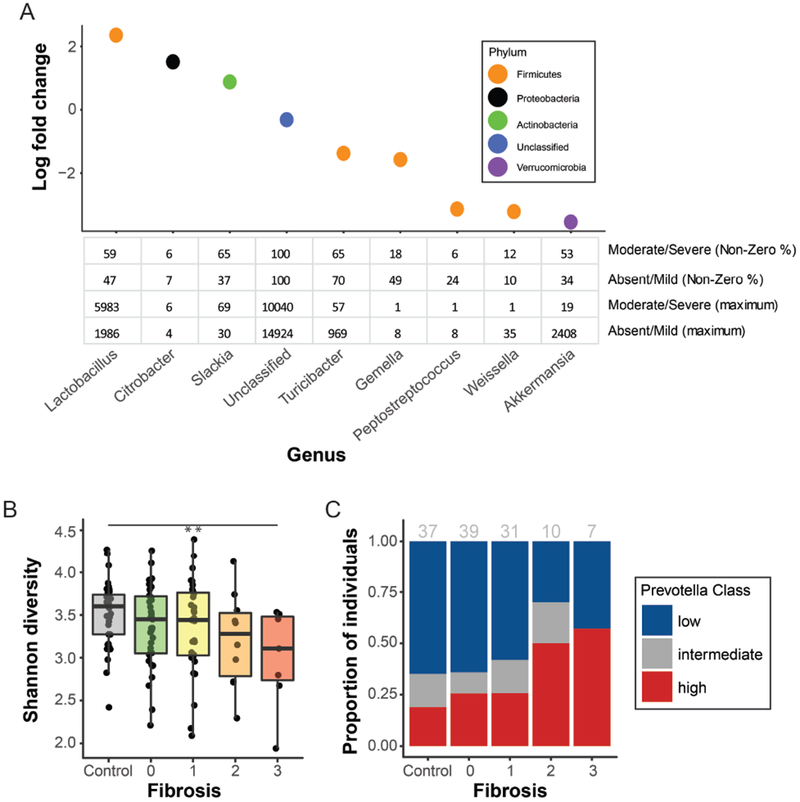
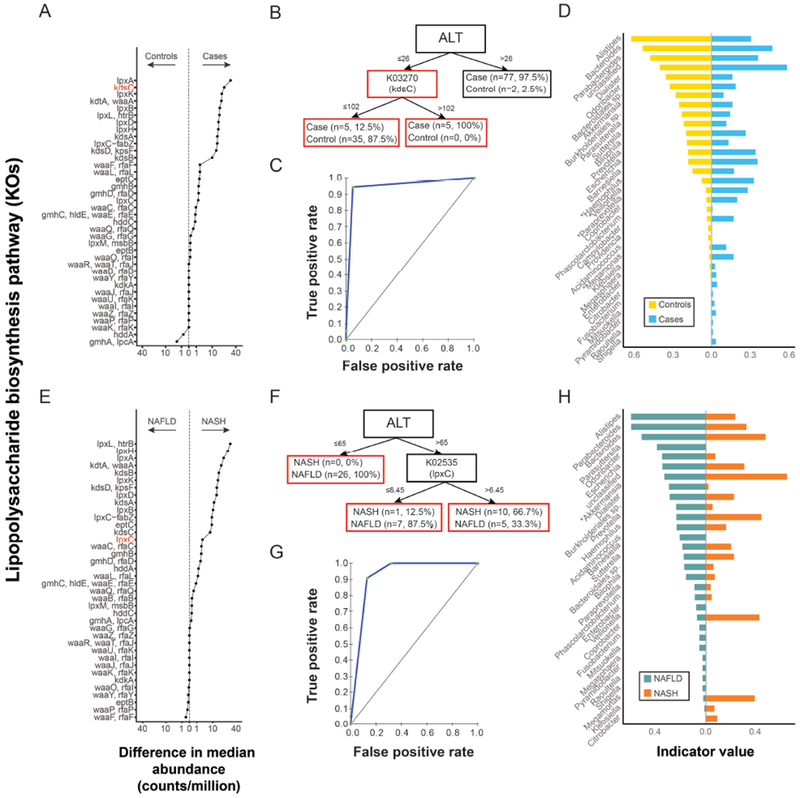
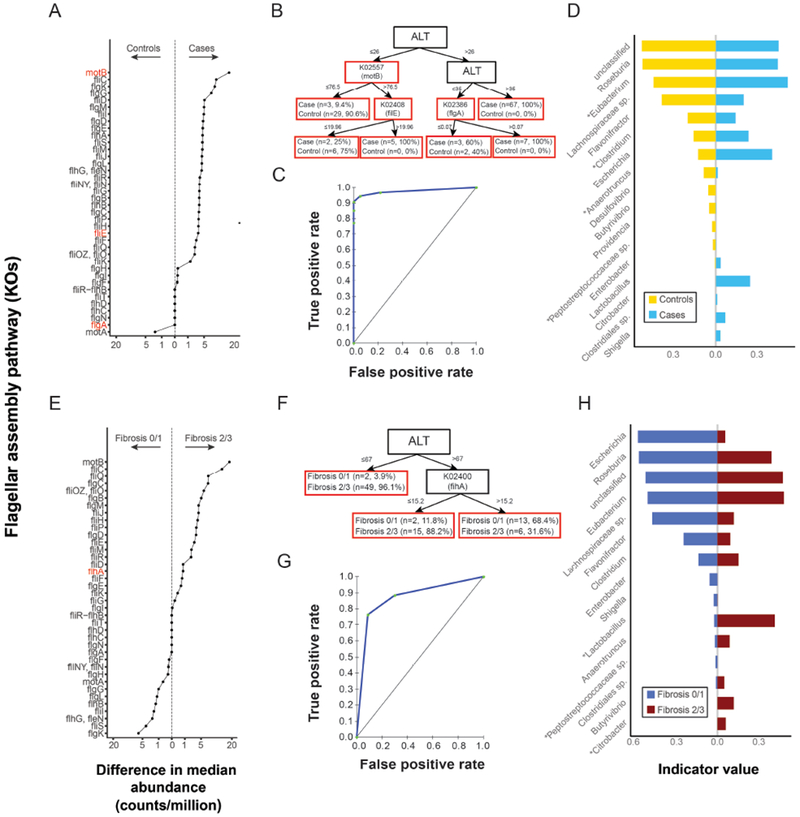
Results: Fecal microbiomes of children with NAFLD had lower α-diversity than those of control children (3.32 vs 3.52, P = .016). Fecal microbiomes from children with nonalcoholic steatohepatitis (NASH) had the lowest α-diversity (control, 3.52; NAFLD, 3.36; borderline NASH, 3.37; NASH, 2.97; P = .001). High abundance of Prevotella copri was associated with more severe fibrosis (P = .036). Genes for lipopolysaccharide biosynthesis were enriched in microbiomes from children with NASH (P < .001). Classification and regression tree model with level of alanine aminotransferase and relative abundance of the lipopolysaccharide pathway gene encoding 3-deoxy-d-manno-octulosonate 8-phosphate-phosphatase identified patients with NASH with an area under the receiver operating characteristic curve value of 0.92. Genes involved in flagellar assembly were enriched in the fecal microbiomes of patients with moderate to severe fibrosis (P < .001). Classification and regression tree models based on level of alanine aminotransferase and abundance of genes encoding flagellar biosynthesis protein had good accuracy for identifying case children with moderate to severe fibrosis (area under the receiver operating characteristic curve, 0.87).

Conclusions: In an analysis of fecal microbiomes of children with NAFLD, we associated NAFLD and NASH with intestinal dysbiosis. NAFLD and its severity were associated with greater abundance of genes encoding inflammatory bacterial products. Alterations to the intestinal microbiome might contribute to the pathogenesis of NAFLD and be used as markers of disease or severity.

Keywords: Flagellin; Intestinal Microbiota; Lipopolysaccharide; Pediatric.


Conflict of interest statement

There is no conflict of interest to disclose

Figures

Figure 1
Figure 1. Taxonomic and community-level changes between NAFLD versus controls.
(A) Bacterial genera identified as being differentially abundant when comparing cases to controls and accounting for ethnicity. The table shows percentage of individuals with non-zero read counts for each genus and maximum number of reads detected in any single individual following normalization. (B) Difference in α-diversity between cases and controls (*p<0.05). (C) Principal coordinates analysis (PCoA) plot showing variation in β-diversity between cases and controls. Each point represents a single patient. Overlaid vectors indicate the direction of change in abundance for top five OTUs correlating with distribution of individuals within the plot.
Figure 2
Figure 2. Taxonomic and community-level changes between NAFLD vs. NASH.
(A) Bacterial genera identified as differentially abundant comparing cases with NAFLD but not NASH vs. definite NASH when accounting for ethnicity. The table shows percentage of individuals with non-zero read counts for each genus and the maximum reads detected in any single individual following normalization. (B) Difference in α-diversity between controls and cases separated by severity (control, 0 = NAFLD but not NASH, 1 = borderline NASH, 2 = definite NASH). (C) Distribution of Prevotella abundance categories (low, intermediate, high,) by severity (control, 0 = NAFLD but not NASH, 1 = borderline NASH, 2 = definite NASH); number per group shown in gray.low, intermediate, or high Prevotella intestinal microbiome by severity (control, 0 = NAFLD but not NASH, 1 = borderline NASH, 2 = definite NASH). Gray numbers above each bar indicate the number of individuals per group.
Figure 3
Figure 3. Taxonomic and community-level changes between absent-to-mild vs. moderate-to-severe-fibrosis.
(A) Bacterial genera differentially abundant by fibrosis stage ( ≤1 vs ≥2) when accounting for ethnicity. Table shows percentage of individuals with non-zero read counts for each genus and maximum reads detected in any single individual following normalization. (B) Difference in α-diversity across fibrosis stages (control, NAFLD with stages 1,2,3) (C) Distribution of Prevotella abundance categories (low, intermediate, high) across across fibrosis stages (control, NAFLD with stages 1,2,3); number per group shown in gray.
Figure 4.
Figure 4.. Lipopolysaccharide biosynthesis (LPS) pathway association with NAFLD and NASH
(A) KEGG Orthologs (KOs) in LPS pathway shown on y-axis and the absolute difference (controls vs cases) in median relative abundance of each KO shown on the x-axis. Values to the left and right of the dashed line indicate KOs found at greater relative abundance in controls and cases, respectively. KOs in red are those appearing in panel B. (B) Classification and regression tree (CART) model for NAFLD based on ALT and the abundance of KOs from the LPS biosynthesis pathway . The corresponding ROC is shown in panel (C). (D) Bacterial genera contributing to LPS assembly in controls and cases are shown on the y-axis. The x-axis depicts indicator values. A large indicator value indicates a genus with both high fidelity to a condition (i.e. the genus was detected as contributing to this pathway in a large proportion of individuals with that condition) and high specificity to a condition (i.e. the genus was found to contribute more to the condition in question than to the alternative condition in the contrast). Asterisks indicate genera present in Fig. 1A. (E) Difference in the median number of reads mapping to the LPS pathway in patients with NAFLD vs NASH. The x and y axis are as described for A. (F) CART model for detecting NASH based on ALT and the abundance of KOs from the LPS pathway as predictor variables. The corresponding ROC is shown in panel (G). (H) Bacterial genera contributing to LPS assembly in patients with NAFLD and patients with NASH. The x and y axis are as described for D. Asterisks indicate genera present in Fig. 2A.
Figure 5.
Figure 5.. Flagellar assembly pathway associations with NAFLD and with fibrosis severity
(A) KEGG Orthologs (KOs) in the flagellar assembly pathway shown on y-axis and the absolute difference (controls vs cases) in median relative abundance of each KO shown on the x-axis. Values to the left and right of the dashed line indicate KOs found at greater relative abundance in controls and cases, respectively. KOs in red are those appearing in panel B. (B) CART model for NAFLD based on ALT and the abundance of KOs from the flagellar assembly pathway as predictor variables. The corresponding ROC is shown in panel (C). (D) Bacterial taxa genera contributing to flagellar assembly in controls and cases are shown on the y-axis. The x-axis depicts indicator values. Asterisks indicate genera present in Fig. 1A. (E) difference in the median number of reads mapping to the flagellar assembly pathway in patients by fibrosis stage ( ≤1 vs ≥2) . The x and y axis are as described for A. (F) CART model for moderate-to-severe fibrosis based on ALT and abundance of KOs from the the flagellar assembly pathway as predictor variables. The corresponding ROC is shown in panel (G). (H) Bacterial genera contributing to flagellar assembly in patients by fibrosis stage ( ≤1 vs ≥2). The x and y axis are as described for D. Asterisks indicate genera present in Fig. 3A.

Comment in

  • Pediatric NAFLD: lessons from the gut.
    Iogna Prat L, Tsochatzis EA. Iogna Prat L, et al. Hepatobiliary Surg Nutr. 2020 Aug;9(4):534-536. doi: 10.21037/hbsn.2020.01.06. Hepatobiliary Surg Nutr. 2020. PMID: 32832512 Free PMC article. No abstract available.

Similar articles

Cited by

References

    1. Schwimmer JB, Deutsch R, Kahen T, et al. Prevalence of fatty liver in children and adolescents. Pediatrics 2006; 118:1388–1393. - PubMed
    1. Schwimmer JB, Behling C, Newbury R, et al. Histopathology of pediatric nonalcoholic fatty liver disease. Hepatology 2005;42:641–649. - PubMed
    1. Turnbaugh PJ, Ley RE, Hamady M, et al. The human microbiome project: exploring the microbial part of ourselves in a changing world. Nature 2007;449:804–810. - PMC - PubMed
    1. The Human Microbiome Consortium. Structure, function and diversity of the healthy human microbiome. Nature 2012;486:207–214. - PMC - PubMed
    1. Round JL, Mazmanian SK. The gut microbiome shapes intestinal immune responses during health and disease. Nat Rev Immunol 2009;9:313–323. - PMC - PubMed

Publication types

MeSH terms