

Comparative mechanisms of PAH toxicity by benzo[a]pyrene and dibenzo[def,p]chrysene in primary human bronchial epithelial cells cultured at air-liquid interface
- PMID: 31255691
- PMCID: PMC6708476
- DOI: 10.1016/j.taap.2019.114644
Comparative mechanisms of PAH toxicity by benzo[a]pyrene and dibenzo[def,p]chrysene in primary human bronchial epithelial cells cultured at air-liquid interface
Abstract
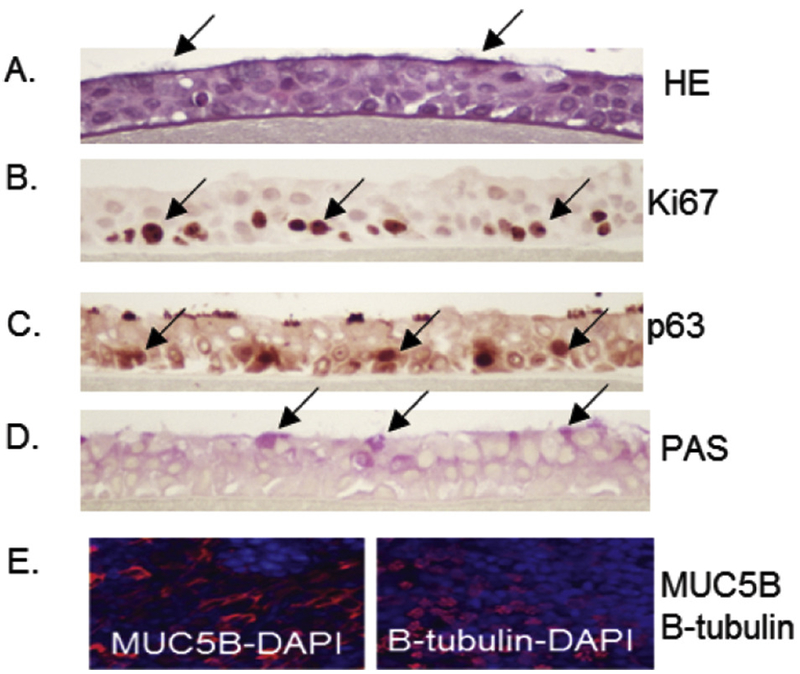
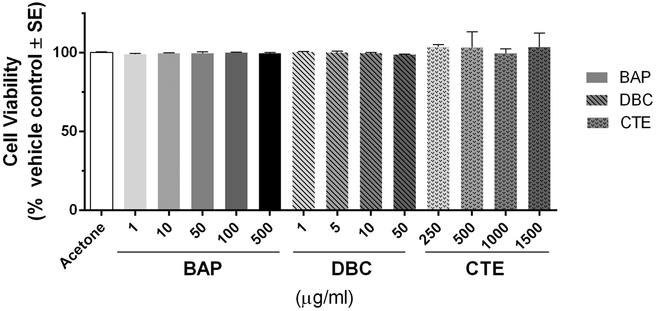
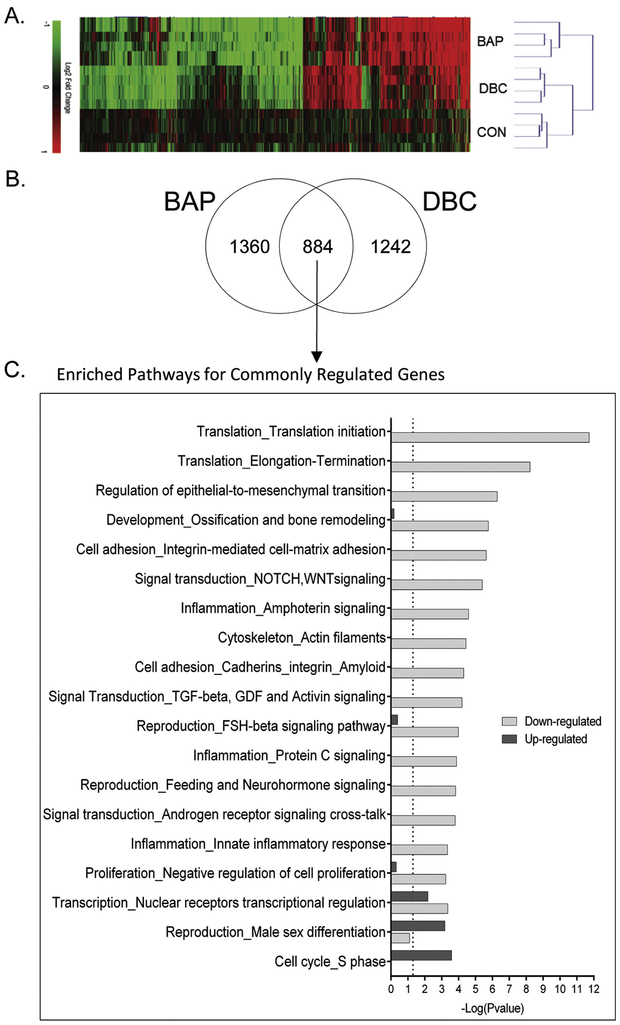
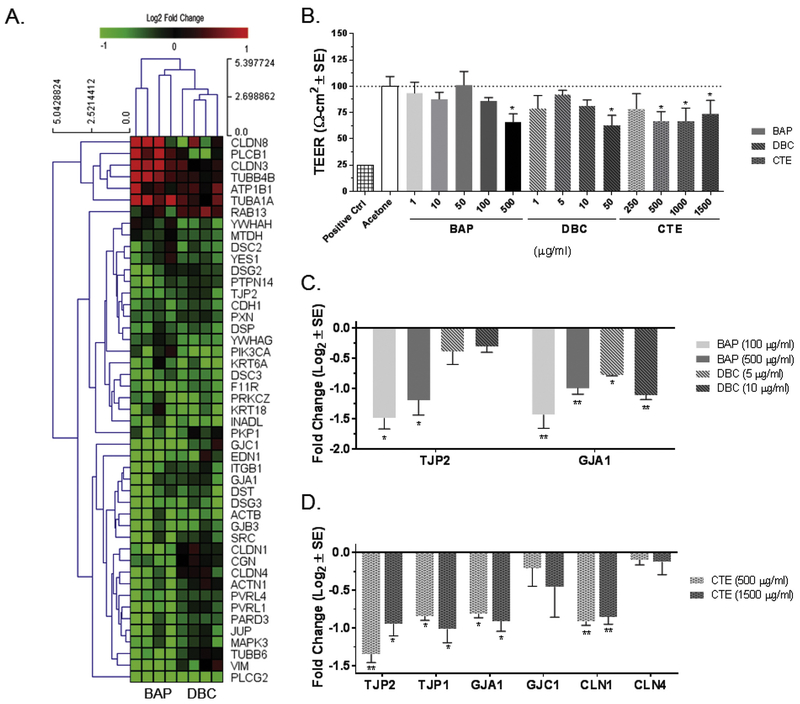
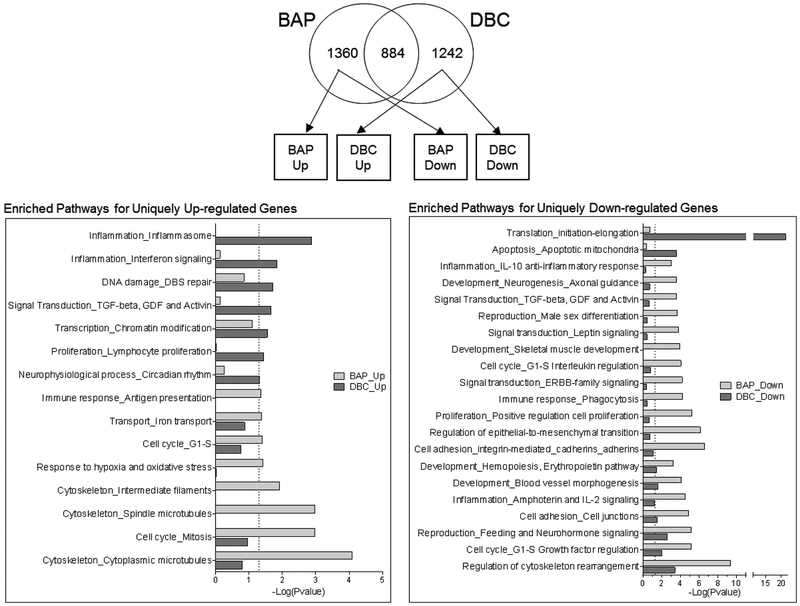
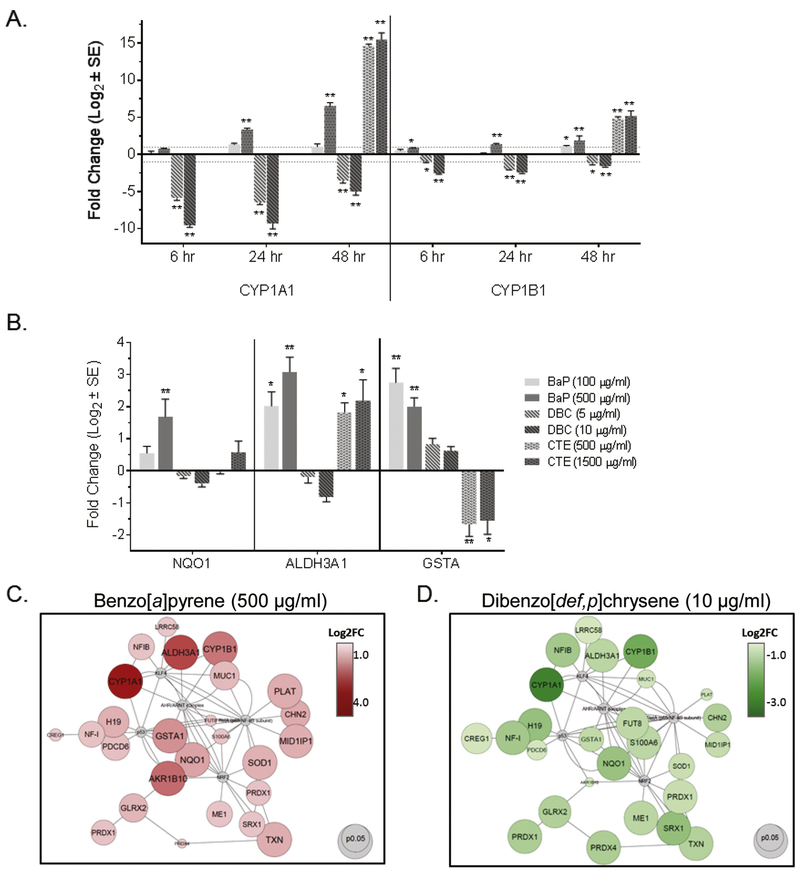
Current assumption for assessing carcinogenic risk of polycyclic aromatic hydrocarbons (PAHs) is that they function through a common mechanism of action; however, recent studies demonstrate that PAHs can act through unique mechanisms potentially contributing to cancer outcomes in a non-additive manner. Using a primary human 3D bronchial epithelial culture (HBEC) model, we assessed potential differences in mechanism of toxicity for two PAHs, benzo[a]pyrene (BAP) and dibenzo[def,p]chrysene (DBC), compared to a complex PAH mixture based on short-term biosignatures identified from transcriptional profiling. Differentiated bronchial epithelial cells were treated with BAP (100-500 μg/ml), DBC (10 μg/ml), and coal tar extract (CTE 500-1500 μg/ml, SRM1597a) for 48 h and gene expression was measured by RNA sequencing or quantitative PCR. Comparison of BAP and DBC gene signatures showed that the majority of genes (~60%) were uniquely regulated by treatment, including signaling pathways for inflammation and DNA damage by DBC and processes for cell cycle, hypoxia and oxidative stress by BAP. Specifically, BAP upregulated targets of AhR, NRF2, and KLF4, while DBC downregulated these same targets, suggesting a chemical-specific pattern in transcriptional regulation involved in antioxidant response, potentially contributing to differences in PAH potency. Other processes were regulated in common by all PAH treatments, BAP, DBC and CTE, including downregulation of genes involved in cell adhesion and reduced functional measurements of barrier integrity. This work supports prior in vivo studies and demonstrates the utility of profiling short-term biosignatures in an organotypic 3D model to identify mechanisms linked to carcinogenic risk of PAHs in humans.
Keywords: Benzo[a]pyrene; Bronchial epithelial cells; Mixtures; Organotypic culture; Polycyclic aromatic hydrocarbons; Toxicogenomics.
Copyright © 2019 Elsevier Inc. All rights reserved.
Conflict of interest statement
Conflict of Interest
The authors declare that there are no conflicts of interest.
Figures
Similar articles
-
Polycyclic aromatic hydrocarbons as skin carcinogens: comparison of benzo[a]pyrene, dibenzo[def,p]chrysene and three environmental mixtures in the FVB/N mouse.Toxicol Appl Pharmacol. 2012 Nov 1;264(3):377-86. doi: 10.1016/j.taap.2012.08.014. Epub 2012 Aug 23. Toxicol Appl Pharmacol. 2012. PMID: 22935520 Free PMC article.
-
Competitive Metabolism of Polycyclic Aromatic Hydrocarbons (PAHs): An Assessment Using In Vitro Metabolism and Physiologically Based Pharmacokinetic (PBPK) Modeling.Int J Environ Res Public Health. 2022 Jul 6;19(14):8266. doi: 10.3390/ijerph19148266. Int J Environ Res Public Health. 2022. PMID: 35886113 Free PMC article.
-
Cytochrome P450 1b1 in polycyclic aromatic hydrocarbon (PAH)-induced skin carcinogenesis: Tumorigenicity of individual PAHs and coal-tar extract, DNA adduction and expression of select genes in the Cyp1b1 knockout mouse.Toxicol Appl Pharmacol. 2015 Sep 1;287(2):149-160. doi: 10.1016/j.taap.2015.05.019. Epub 2015 Jun 3. Toxicol Appl Pharmacol. 2015. PMID: 26049101 Free PMC article.
-
Application of the margin-of-exposure (MoE) approach to substances in food that are genotoxic and carcinogenic e.g.: benzo[a]pyrene and polycyclic aromatic hydrocarbons.Food Chem Toxicol. 2010 Jan;48 Suppl 1:S42-8. doi: 10.1016/j.fct.2009.09.039. Epub 2009 Oct 8. Food Chem Toxicol. 2010. PMID: 19818825 Review.
-
Effects of polycyclic aromatic hydrocarbons (PAHs) on pregnancy, placenta, and placental trophoblasts.Ecotoxicol Environ Saf. 2023 Aug 1;262:115314. doi: 10.1016/j.ecoenv.2023.115314. Online ahead of print. Ecotoxicol Environ Saf. 2023. PMID: 37536008 Review.
Cited by
-
Loading of Coal Tar in Polymeric Nanoparticles as a Potential Therapeutic Modality for Psoriasis.ACS Omega. 2022 Feb 18;7(8):7333-7340. doi: 10.1021/acsomega.1c07267. eCollection 2022 Mar 1. ACS Omega. 2022. PMID: 35252723 Free PMC article.
-
Discovery of firefighter chemical exposures using military-style silicone dog tags.Environ Int. 2020 Sep;142:105818. doi: 10.1016/j.envint.2020.105818. Epub 2020 Jun 7. Environ Int. 2020. PMID: 32521346 Free PMC article.
-
Utilization of the CometChip assay for detecting PAH-induced DNA bulky adducts in a 3D primary human bronchial epithelial cell model.Toxicology. 2025 Nov;517:154241. doi: 10.1016/j.tox.2025.154241. Epub 2025 Jul 23. Toxicology. 2025. PMID: 40713011 Free PMC article.
-
Classifying polycyclic aromatic hydrocarbons by carcinogenic potency using in vitro biosignatures.Toxicol In Vitro. 2020 Dec;69:104991. doi: 10.1016/j.tiv.2020.104991. Epub 2020 Sep 2. Toxicol In Vitro. 2020. PMID: 32890658 Free PMC article.
-
Metabolic Activation of Benzo[a]pyrene by Human Tissue Organoid Cultures.Int J Mol Sci. 2022 Dec 29;24(1):606. doi: 10.3390/ijms24010606. Int J Mol Sci. 2022. PMID: 36614051 Free PMC article.
References
-
- Abdel-Shafy HI, & Mansour MSM (2016). A review on polycyclic aromatic hydrocarbons: Source, environmental impact, effect on human health and remediation. Egyptian Journal of Petroleum, 25(1), 107–123. doi:10.1016/j.ejpe.2015.03.011 - DOI
-
- Arlt VM, Krais AM, Godschalk RW, Riffo-Vasquez Y, Mrizova I, Roufosse CA, Corbin C, Shi Q, Frei E, Stiborova M, van Schooten FJ, Phillips DH, & Spina D (2015). Pulmonary Inflammation Impacts on CYP1A1-Mediated Respiratory Tract DNA Damage Induced by the Carcinogenic Air Pollutant Benzo[a]pyrene. Toxicol Sci, 146(2), 213–225. doi:10.1093/toxsci/kfv086 - DOI - PMC - PubMed
Publication types
MeSH terms
Substances
Grants and funding
LinkOut - more resources
Full Text Sources
Molecular Biology Databases
