. 2019 Jun 29;11(12):4216-4237.
doi: 10.18632/aging.102048.

β-catenin-mediated hair growth induction effect of 3,4,5-tri- O-caffeoylquinic acid

Affiliations

β-catenin-mediated hair growth induction effect of 3,4,5-tri- O-caffeoylquinic acid

Meriem Bejaoui et al. Aging (Albany NY). .

Abstract

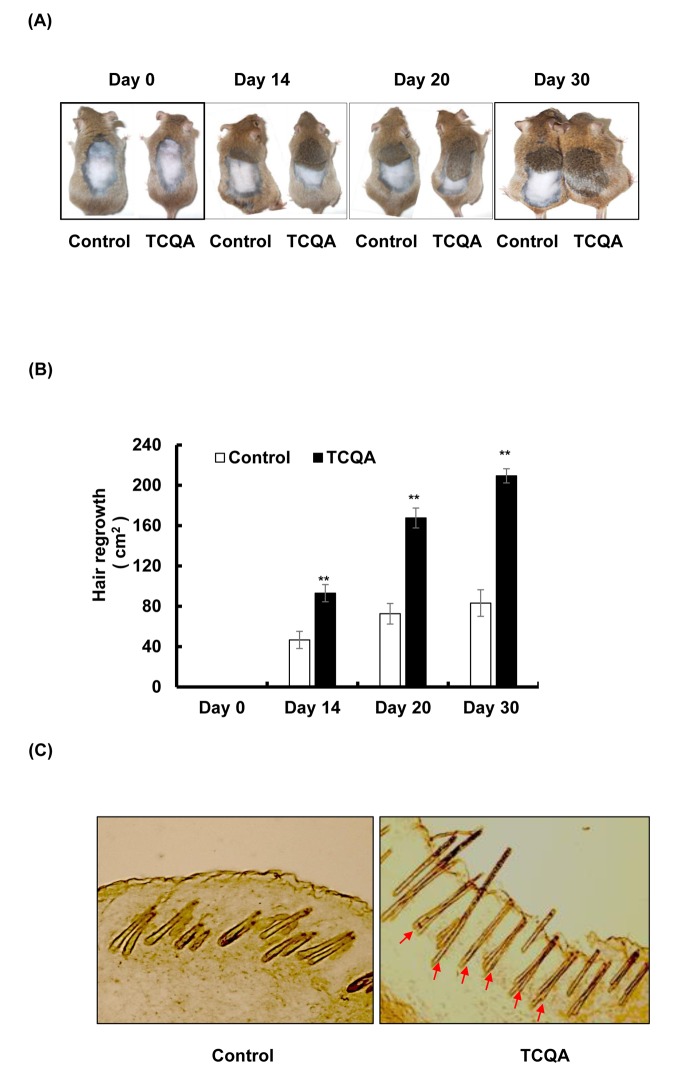
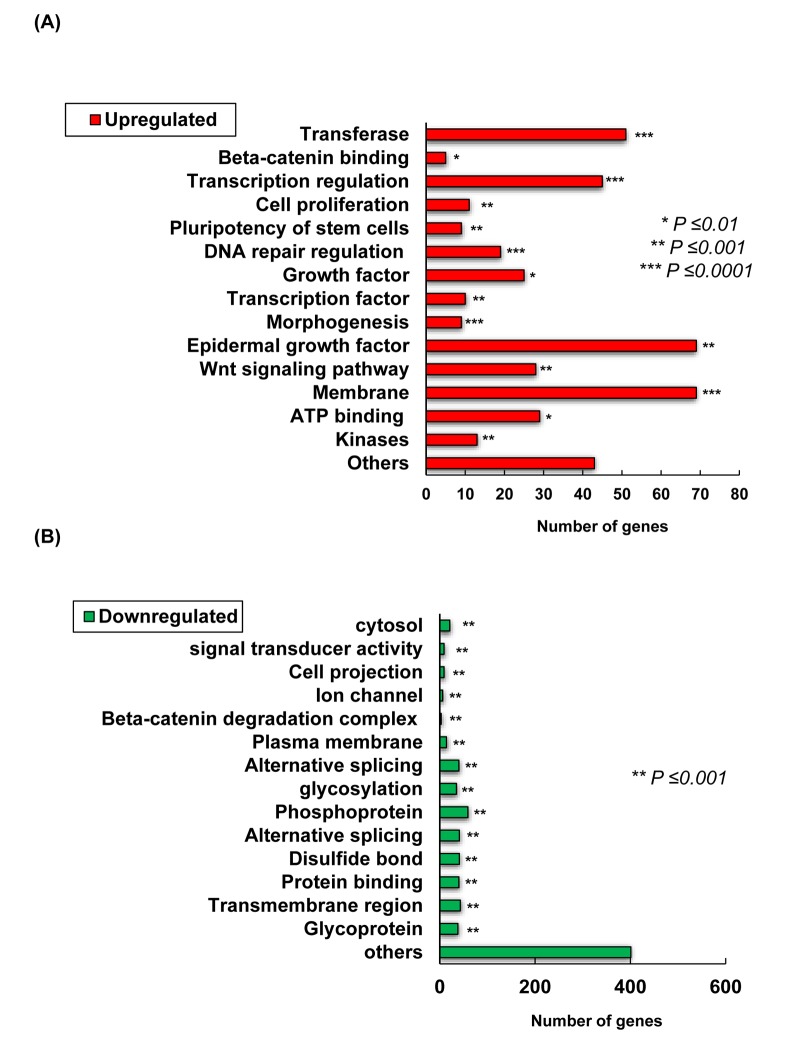
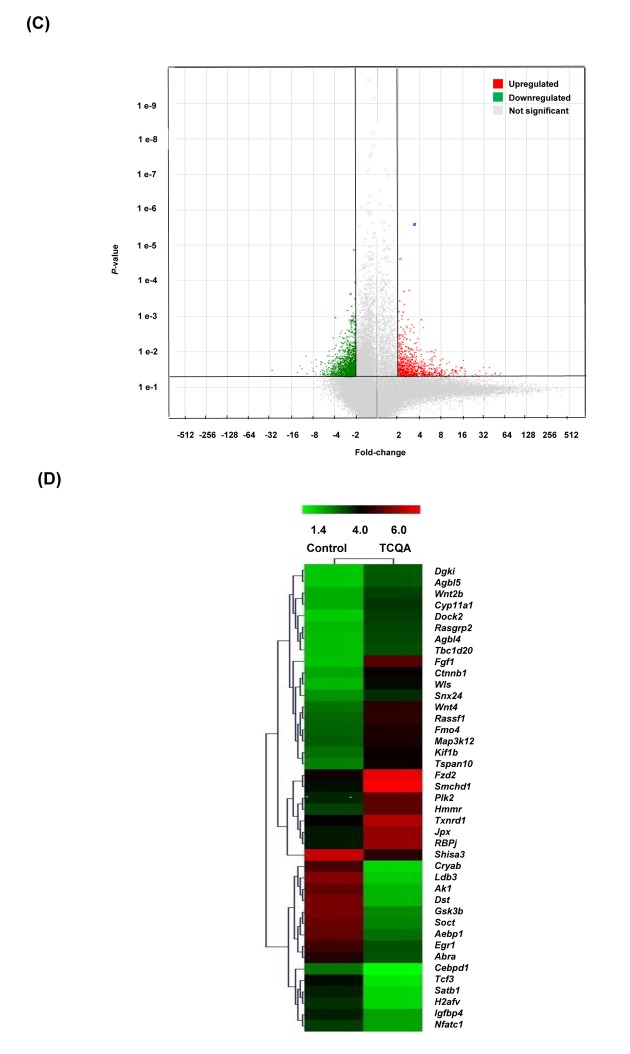
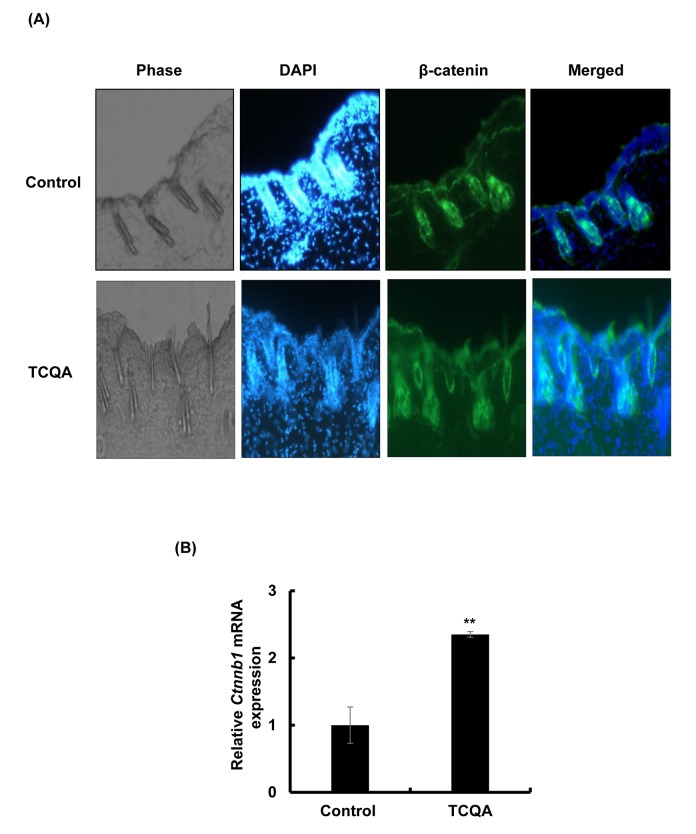
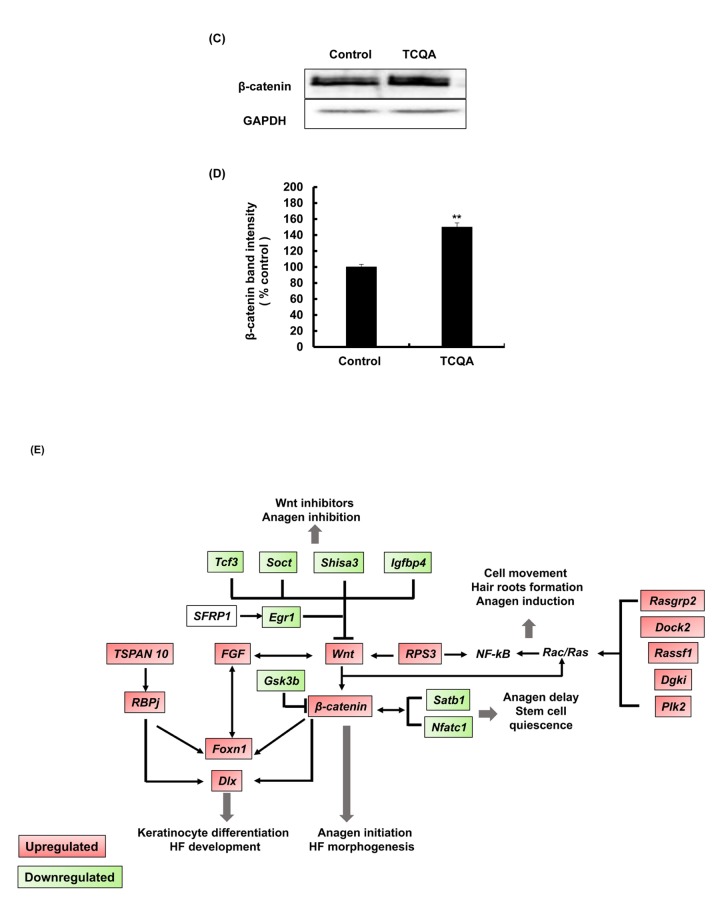
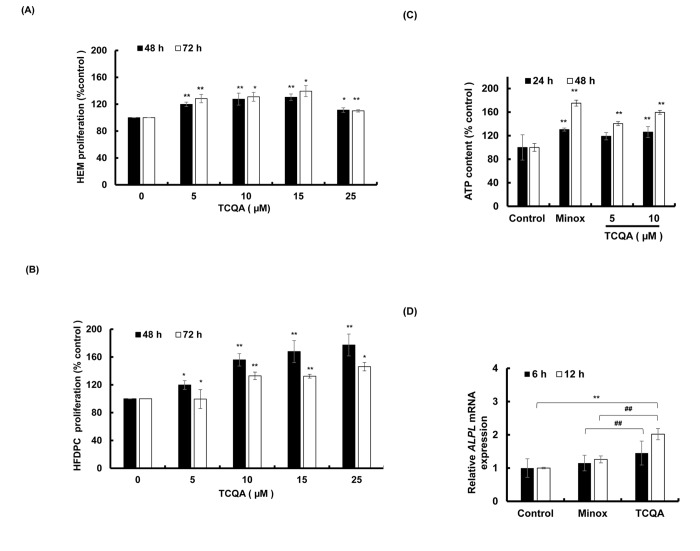
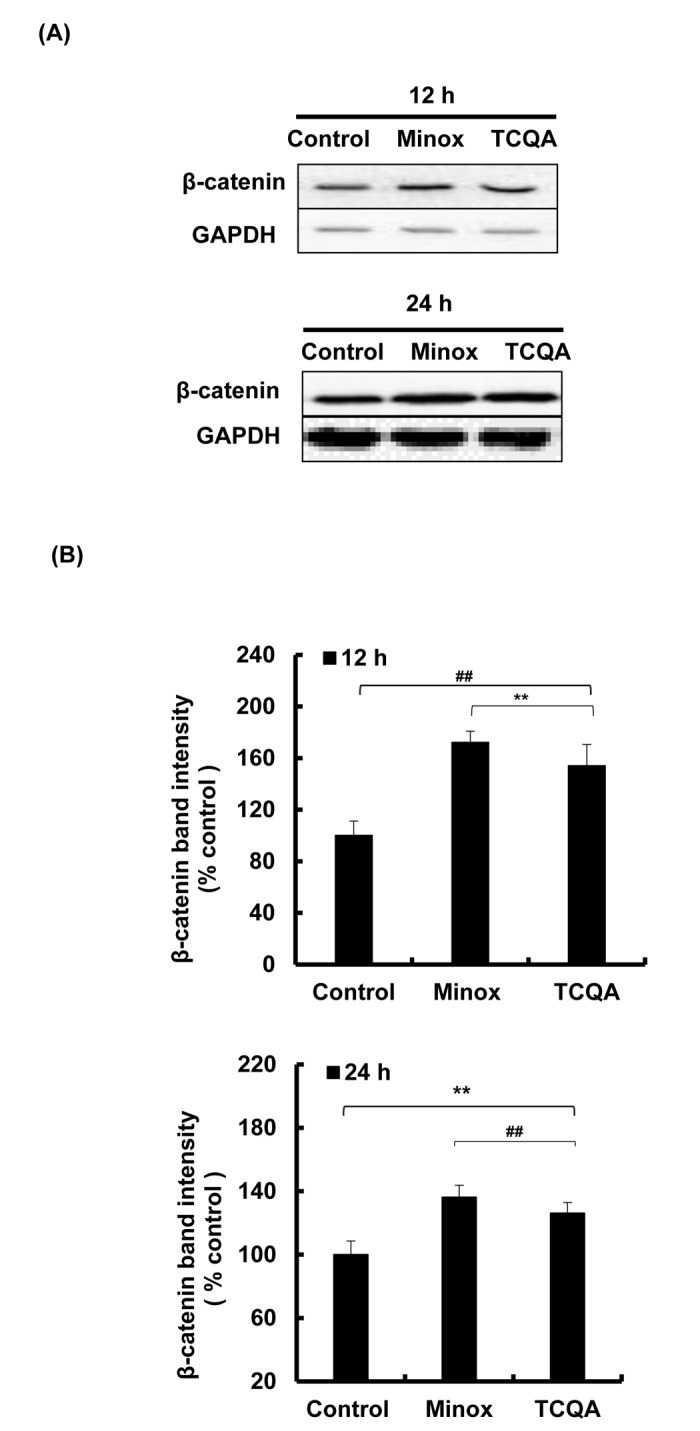
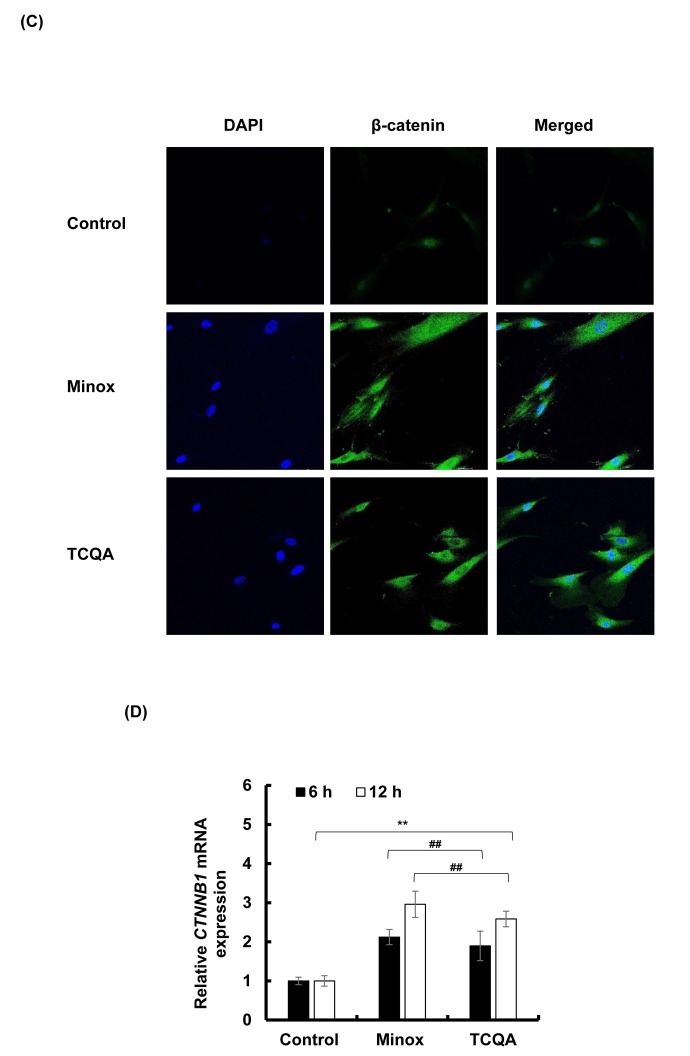
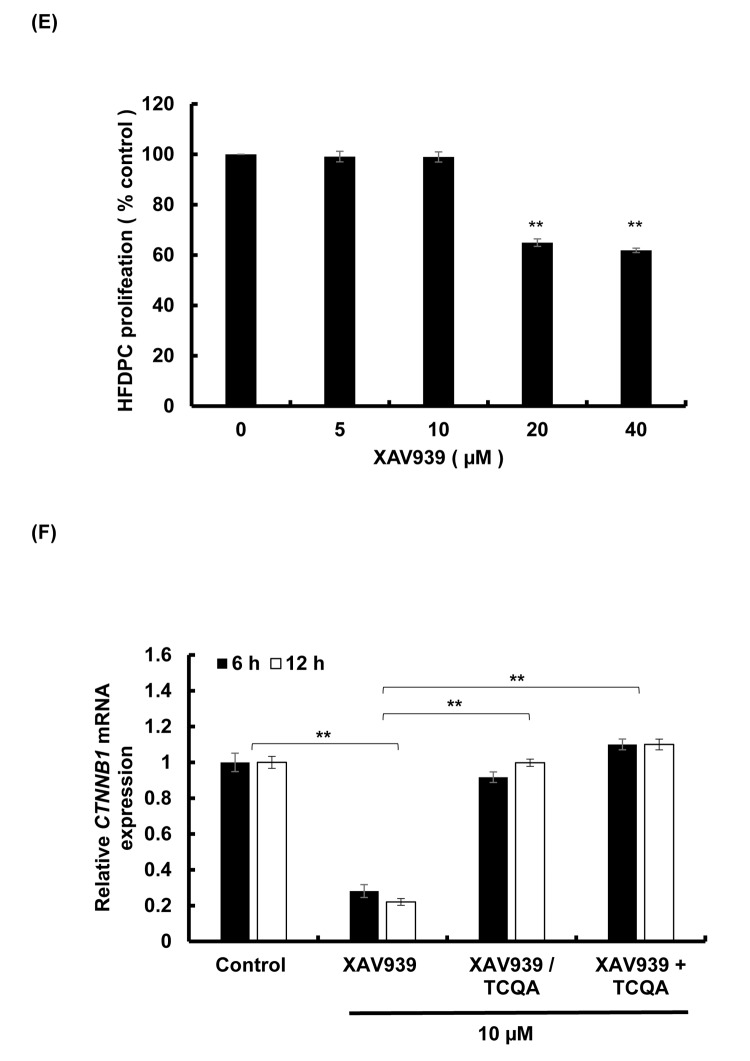
The hair follicle is a complex structure that goes through a cyclic period of growth (anagen), regression (catagen), and rest (telogen) under the regulation of several signaling pathways, including Wnt/ β-catenin, FGF, Shh, and Notch. The Wnt/β-catenin signaling is specifically involved in hair follicle morphogenesis, regeneration, and growth. β-catenin is expressed in the dermal papilla and promotes anagen induction and duration, as well as keratinocyte regulation and differentiation. In this study, we demonstrated the activation of β-catenin by a polyphenolic compound 3,4,5-tri-O-caffeoylquinic acid (TCQA) in mice model and in human dermal papilla cells to promote hair growth cycle. A complete regrowth of the shaved area of C3H mice was observed upon treatment with TCQA. Global gene expression analysis using microarray showed an upregulation in hair growth-associated genes. Moreover, the expression of β-catenin was remarkably upregulated in vivo and in vitro. These findings suggest that β-catenin activation by TCQA promoted the initiation of the anagen phase of the hair cycle.

Keywords: 3,4,5-tri--caffeoylquinic acid (TCQA) O; Wnt/ β-catenin pathway; anagen; dermal papilla; β-catenin.


Conflict of interest statement

CONFLICTS OF INTEREST: The authors declare that there are no conflicts of interest related to this work.

Figures

Figure 1
Figure 1
TCQA promoted hair regrowth in C3H mice skin. (A) The back skin of eight-weeks-old male C3H mice was shaved and treated daily with topical application of 1 wt% TCQA (1 g TCQA in 100 ml milli-Q water) and with milli-Q water (control) for 30 days. (B) The area of the new generated coat was measured by ImageJ. (C) Skin from treated area from TCQA-treated group and control group were cut at thickness of 10 µM and visualized under the microscope. *Statistically significant (P ≤0.05) difference between control and TCQA-treated group. **Statistically significant (P ≤0.01) difference between control and TCQA-treated mice.
Figure 2AB
Figure 2AB
Transcriptome changes induced by TCQA, 1235 genes were significantly selected: 435 were upregulated and 800 downregulated. (A) Summary of the functional categories of upregulated genes in response to TCQA treatment. (B) Summary of the functional categories of downregulated genes in response to TCQA treatment. Analyses for the down and upregulated genes were performed individually using Database for Annotation, Visualization and Integrated Discovery v6.8 (DAVID). Bars represent the number of genes implicated in each category. *Statistically significant (P ≤0.01). **Statistically significant (P ≤0.001). ***Statistically significant (P ≤0.0001).
Figure 2CD
Figure 2CD
Transcriptome changes induced by TCQA, 1235 genes were significantly selected: 435 were upregulated and 800 downregulated. (C) Hierarchical clustering of the genes altered after treatment with TCQA using Euclidean distance and average linkage algorithm of the TIGR Mev version 3.0.3 software (The Institute for Genomic Research, MD, USA). Horizontal stripes represent genes and columns represent control and TCQA. The significant fold change in gene expression is 2-fold change (control vs TCQA). (D) The volcano plot represents the regulated genes between the control and TCQA. The red color represents the upregulated genes, the green color the downregulated genes, and the grey color the unregulated genes. The expression of the genes above or below, left or right, the lines differed more than 2-fold change between the control and TCQA group.
Figure 3AB
Figure 3AB
TCQA enhanced β-catenin expression in the hair follicle. (A) Immunohistochemistry was performed to measure β-catenin expression in the hair follicle and the epidermis in skin collected from the treated area from mice dorsal skin at 30 days after treatment. The figure is divided into four panels, the first panel is the phase, the second is DAPI to stain the nucleus, the third is for β-catenin staining, and the last panel is a merge between β-catenin and the nucleus. (B) Ctnnb1 mRNA relative expression was measured after treatment with TCQA at 30 days after treatment. The mRNA level was quantified using TaqMan real-time PCR from RNA extracted from the treated area (TCQA or milli-Q water) from the mice dorsal back.
Figure 3C-E
Figure 3C-E
TCQA enhanced β-catenin expression in the hair follicle. (C) β-catenin protein expression was determined at the end of the treatment period. The protein was extracted from the treated area from the mice dorsal part, and western blot was carried away. (D) Band intensities was done assessed using LI-COR system. Results represent the mean ± SD of three independent experiments. *Statistically significant (P ≤0.05) difference between control and TCQA-treated mice. **Statistically significant (P ≤0.01) difference between control and TCQA-treated mice. (E) Summary of the up and downregulated genes modulated by TCQA compared with the control. The red color represents the upregulated genes and the green color the downregulated genes.
Figure 4
Figure 4
TCQA stimulated hair bulb cells proliferation. (A) Cell proliferation of human epidermal melanocytes (HEM) was assessed after 48 and 72 h treatment with various concentrations of TCQA. (B) Cell proliferation of human hair follicle dermal papilla cells (HFDPCs) was assessed after 48 and 72 h treatment with various concentrations of TCQA. (C) ATP content determination after treatment with 5 and 10 µM of TCQA and 0.1 µM of minoxidil (Minox) used as positive control. (D) Gene expression of ALPL (Alkaline Phosphatase) after 6 and 12 h treatment with 0, 10 µM TCQA, and 0.1 Minox. The mRNA level was quantified using TaqMan real-time PCR after treatment. Results represent the mean ± SD of three independent experiments. *Statistically significant (P ≤0.05) difference between control and treated cells. **Statistically significant (P ≤0.01) difference between control and treated cells. ##Statistically significant (P ≤0.01) difference between Minox-treated cells and TCQA-treated cells.
Figure 5AB
Figure 5AB
TCQA stimulated β-catenin expression in human hair follicle dermal papilla cells (HFDPCs). (A) β-catenin protein expression after 12 and 24 h treatment with 0 and 10 µM TCQA and 0.1 µM Minox. (B) Band intensities was done using LI-COR system after 12 h and 24 h treatment.
Figure 5CD
Figure 5CD
TCQA stimulated β-catenin expression in human hair follicle dermal papilla cells (HFDPCs). (C) Immunocytochemistry of β-catenin expression in HFDPC after 24 h treatment with 0, 10 µM TCQA and 0.1 µM Minox. Scale bar=25 µm; magnificence 40 X. (D) Gene expression of CTNNB1 (β-catenin) after treatment with 0 and 10 µM TCQA, and 0.1 µM Minox for 6 h and 12 h. The mRNA level was quantified using TaqMan real-time PCR after treatment.
Figure 5EF
Figure 5EF
TCQA stimulated β-catenin expression in human hair follicle dermal papilla cells (HFDPCs) (E) Cell proliferation of HFDPC was assessed after 48 h treatment with various concentrations of XAV939 (β-catenin inhibitor). (F) Gene expression expressions of CTNNB1 (β-catenin) after treatment with 10 µM XAV939 for 6 and 12 h, with 10 µM XAV939 for 6 and 12 h then with 10 µM TCQA for 6 h and 12 h (XAV939/TCQA), and finally with co-treatment of 10 µM XAV939 and 10 µM TCQA for 6 and 12 h (XAV939+TCQA). Results represent the mean ± SD of three independent experiments. *Statistically significant (P ≤0.05) difference between control and treated cells. **Statistically significant (P ≤0.01) difference between control and treated cells. ##Statistically significant (P ≤0.01) difference between Minox-treated cells and TCQA-treated cells.

References

    1. Rushton DH, Norris MJ, Dover R, Busuttil N. Causes of hair loss and the developments in hair rejuvenation. Int J Cosmet Sci. 2002; 24:17–23. 10.1046/j.0412-5463.2001.00110.x - DOI - PubMed
    1. Patel M, Harrison S, Sinclair R. Drugs and hair loss derm clinics. Dermatol Clin. 2013; 31:3065 10.1016/j.det.2012.08.002 - DOI - PubMed
    1. Rosenquist TA, Martin GR. Fibroblast growth factor signalling in the hair growth cycle: expression of the fibroblast growth factor receptor and ligand genes in the murine hair follicle. Dev Dyn. 1996; 205:379–86. 10.1002/(SICI)1097-0177(199604)205:4<379::AID-AJA2>3.0.CO;2-F - DOI - PubMed
    1. Paus R, Cotsarelis G, He B. The biology of hair follicles. N Engl J Med. 1999; 341:491–97. 10.1056/NEJM199908123410706 - DOI - PubMed
    1. Cotsarelis G, Sun TT, Lavker RM. Label-retaining cells reside in the bulge area of pilosebaceous unit: implications for follicular stem cells, hair cycle, and skin carcinogenesis. Cell. 1990; 61:1329–37. 10.1016/0092-8674(90)90696-C - DOI - PubMed

Publication types