Review
. 2019 Aug;37(3):505-526.
doi: 10.1016/j.ncl.2019.05.001.

Assessment of Circadian Rhythms

Affiliations
Review

Assessment of Circadian Rhythms

Kathryn J Reid. Neurol Clin. 2019 Aug.

Abstract

Circadian rhythms are observed in most physiologic functions across a variety of species and are controlled by a master pacemaker in the brain called the suprachiasmatic nucleus. The complex nature of the circadian system and the impact of circadian disruption on sleep, health, and well-being support the need to assess internal circadian timing in the clinical setting. The ability to assess circadian rhythms and the degree of circadian disruption can help in categorizing subtypes or even new circadian rhythm disorders and aid in the clinical management of the these disorders.

Keywords: Circadian rhythm sleep-wake disorders; Circadian rhythms; Core body temperature; Dim light melatonin onset; Rest-activity cycles.


Figures

Figure 1.
Figure 1.. Parameters of Circadian Rhythms.
A representative circadian rhythm is depicted in which the level of a particular measure (e.g., blood hormone levels and activity levels) varies according to time. The difference in the level between peak and trough values is the amplitude of the rhythm. The timing of a reference point in the cycle (e.g., the peak) relative to a fixed event (e.g., beginning of the night phase) is the phase. The time interval between phase reference points (e.g., two peaks) is called the period. The rhythm shown persists even in continuous darkness (i.e., is free running). ( (From Vitaterna MH, Takahashi JS, Turek FW. Overview of circadian rhythms. Alcohol Res Health 2001;25:85-93; with permission)
Figure 2.
Figure 2.. An example of the rest-activity rhythm in a patient with non-24 hour sleep-wake phase disorder recorded with wrist activity monitoring.
In this figure activity level (dark tick marks) is double plotted which means that each line includes two days between mid-night to mid-night and that part of the second day is plotted on the line below. The rest-activity rhythm in those with non-24-hour sleep-wake phase disorder typically progressively delays each days so that at certain times the rest period occurs during the daytime. (From Reid KJ, Zee PC. Circadian Rhythm Sleep Disorders. In: Kryger M, ed. Atlas of Clinical Sleep Medicine. 2nd ed: Saunder, Elsevier, 2013; with permission.)
Figure 3.
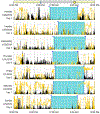
Figure 3.. An example of the rest-activity rhythm from a healthy older adult recorded with wrist activity monitoring.
Each row is a 24-hour day from 12pm to 12pm the next day. Activity levels are indicated in black and light levels in yellow. The light blue shaded area indicates the sleep period. The small blue triangles at the beginning and end of the light blue shaded sleep period are markers selected by the individual to indicate when they went to bed and when they woke up. The individual has a stable nocturnal sleep-wake period and woke up several times during the night (an example of this can be seen on day 3 as the increase in activity and light within the sleep period).
Figure 4.
Figure 4.. Illustrative examples of melatonin levels measured using 3 different methods and their associated phase estimates.
(A) 24-hour rhythm of primary melatonin metabolite 6-sulphatoxymeltonin (aMT6s) derived from urine samples collected in 2-hour bins under dim light. The fitted curve reveals a significant 24-hour rhythm with maximum levels observed between 04:00am and 08:00am (**p<0.01). (B) Salivary melatonin profile collected under dim-light conditions. The low threshold dim light melatonin onset (DLMO) was defined as either the first sample to exceed and remain above a threshold of 3 pg/mL or that was 2 SD above the mean of the first 3 baseline samples (2 SD). (C) Overnight plasma melatonin profile, plotted as a percentage of maximum (dashed line) and smoothed with a Lowess curve fit to the raw data (solid line). Some frequently used phase markers are shown: DLMO at 10 pg/mL, DLMO or dim-light melatonin offset (DLMOff) at 25% or 50% of maximum levels, the midpoint, and the termination of melatonin synthesis (Synoff). (From Benloucif S, Burgess HJ, Klerman EB, et al. Measuring melatonin in humans. J Clin Sleep Med 2008;4:66-9; with permission.)
Figure 5.
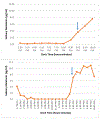
Figure 5.. Salivary melatonin levels for (A) 5-hours prior to bedtime and (B) 22-hours of sampling.
The top panel (A) represents an example from a single individual using a common method for sampling salivary melatonin levels at home. This includes 11 total samples each taken at 30-minute intervals for the 5 hours prior to habitual bedtime. DLMO was calculated using the 2 SD threshold and occurred at 8:30pm, if the 3 pg/ml threshold method is used the DLMO would be reported as 9:00pm (indicated by the arrow). The bottom panel (B) represents an example for an individual that collected samples hourly for 22 hours. DLMO for this individual occurred at 3:00am using the 2 SD criteria or at 4:00am if using the 3pg/ml threshold criteria (indicated by the arrow).
Figure 6.
Figure 6.. Salivary melatonin levels for (A) 6.5 hours prior to bedtime.
In this example it was not possible to calculate the DLMO as there was no clearly discernable melatonin levels measured. It is unclear in this case whether the DLMO was simply missed altogether or whether the individual did not follow the instructions for sample collection (i.e. they did not dim lights, which would suppress melatonin production).
Figure 7.
Figure 7.. 24-hour recording of core body temperature.
This is an example of a 24-hour recording of rectal temperature from a patient with delayed sleep-wake phase disorder. Clock time (hours:minutes) is indicated on the x-axis and temperature (degrees Celsius) on the y-axis. The raw temperature data is indicated by the blue line while the pink line indicates the fitted curve for the calculation of core body temperature minimum. The calculated core body temperature is indicated by the black arrow and was at 9am. The declining portion of the CBT rhythm begins at about 3am and the rising potion of the rhythm occurs at 11am. This would make it difficult for this person to fall asleep earlier than 3am and wake before 11am and if they did wake at 11am they would likely report feeling very sleepy as the CBT is still low. (From Reid KJ, Zee PC. Circadian Rhythm Sleep Disorders. In: Kryger M, ed. Atlas of Clinical Sleep Medicine. 2nd ed: Saunder, Elsevier, 2013; with permission.)
Figure 8.
Figure 8.. An example of activity, light and skin temperature levels with a wrist worn device between 3pm-10am.
Activity levels are indicated in blue, light levels in yellow and skin temperature in red. The light blue shaded area indicates the sleep period. In contrast to core body temperature, you will note that skin temperature is higher during the sleep period when core temperature is normally lower.

References

    1. International Classification of Sleep Disorders. 3rd ed: American Acadmey of Sleep Medicine, 2014. - PMC - PubMed
    1. Vitaterna MH, Takahashi JS, Turek FW. Overview of circadian rhythms. Alcohol Res Health 2001;25:85–93. - PMC - PubMed
    1. Burgess HJ, Revell VL, Molina TA, Eastman CI. Human phase response curves to three days of daily melatonin: 0.5 mg versus 3.0 mg. J Clin Endocrinol Metab 2010;95:3325–31. - PMC - PubMed
    1. Khalsa SB, Jewett ME, Cajochen C, Czeisler CA. A phase response curve to single bright light pulses in human subjects. J Physiol 2003;549:945–52. - PMC - PubMed
    1. Kim SJ, Benloucif S, Reid KJ, et al. Phase-shifting response to light in older adults. J Physiol 2014;592:189–202. - PMC - PubMed

Publication types