. 2019 Jul 11;178(2):316-329.e18.
doi: 10.1016/j.cell.2019.06.003. Epub 2019 Jun 27.

Nrf2 Activation Promotes Lung Cancer Metastasis by Inhibiting the Degradation of Bach1

Affiliations

Nrf2 Activation Promotes Lung Cancer Metastasis by Inhibiting the Degradation of Bach1

Luca Lignitto et al. Cell. .

Abstract

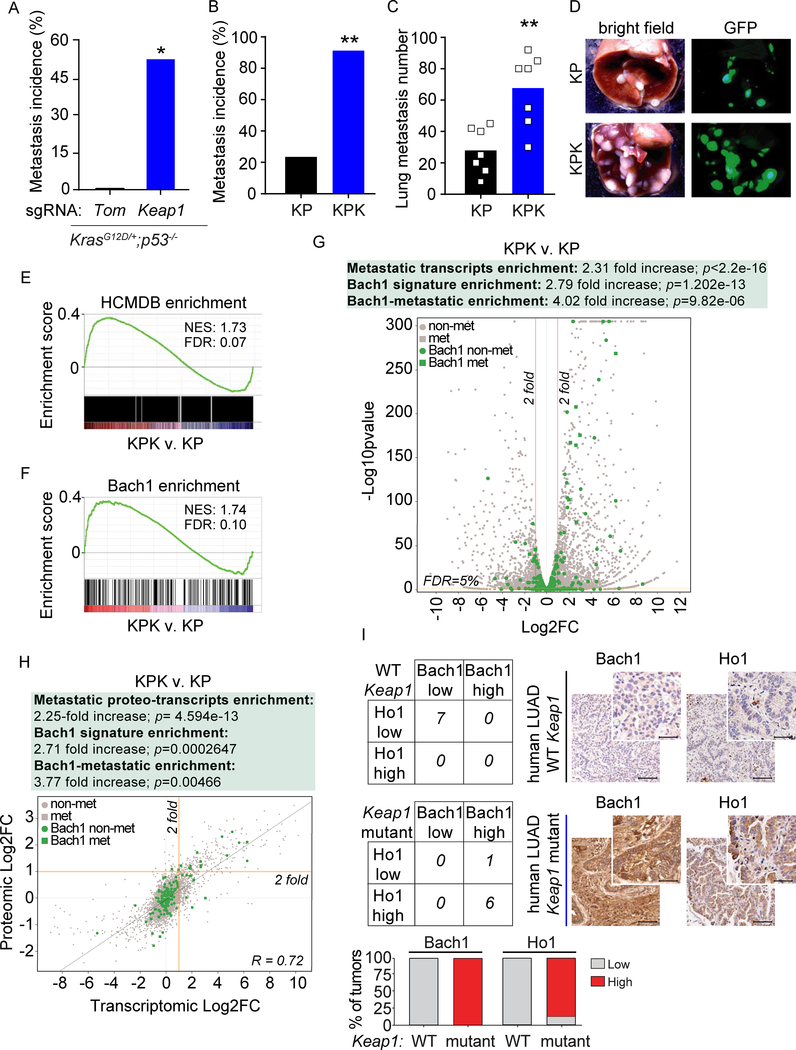
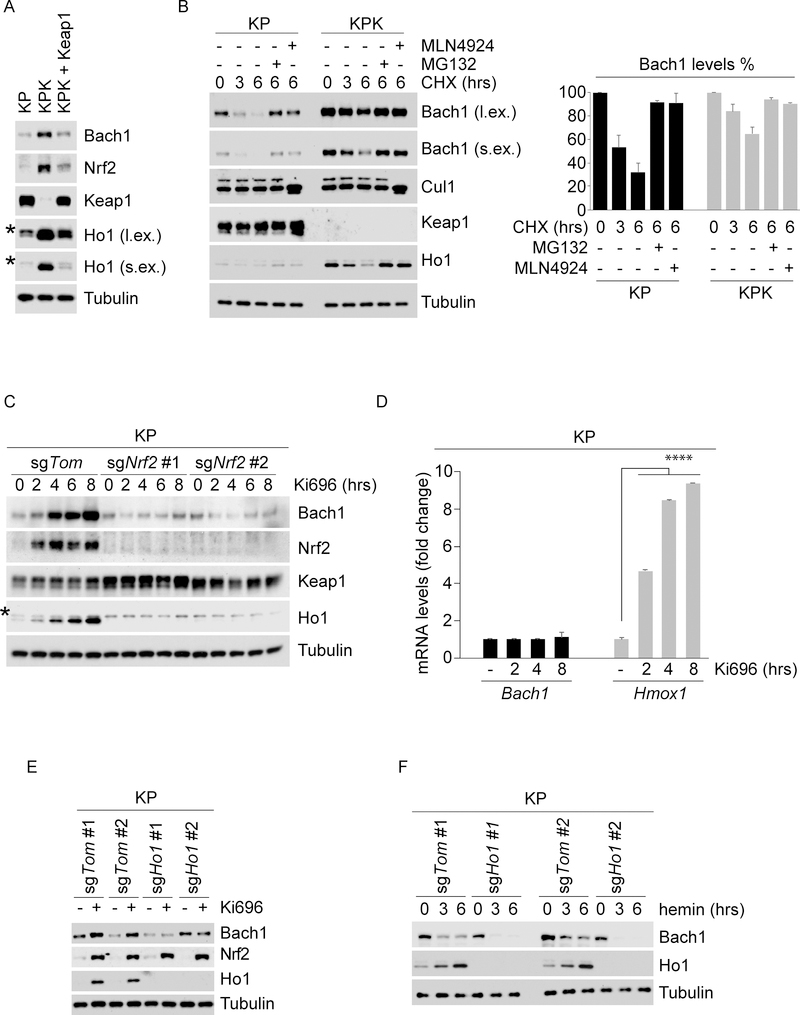
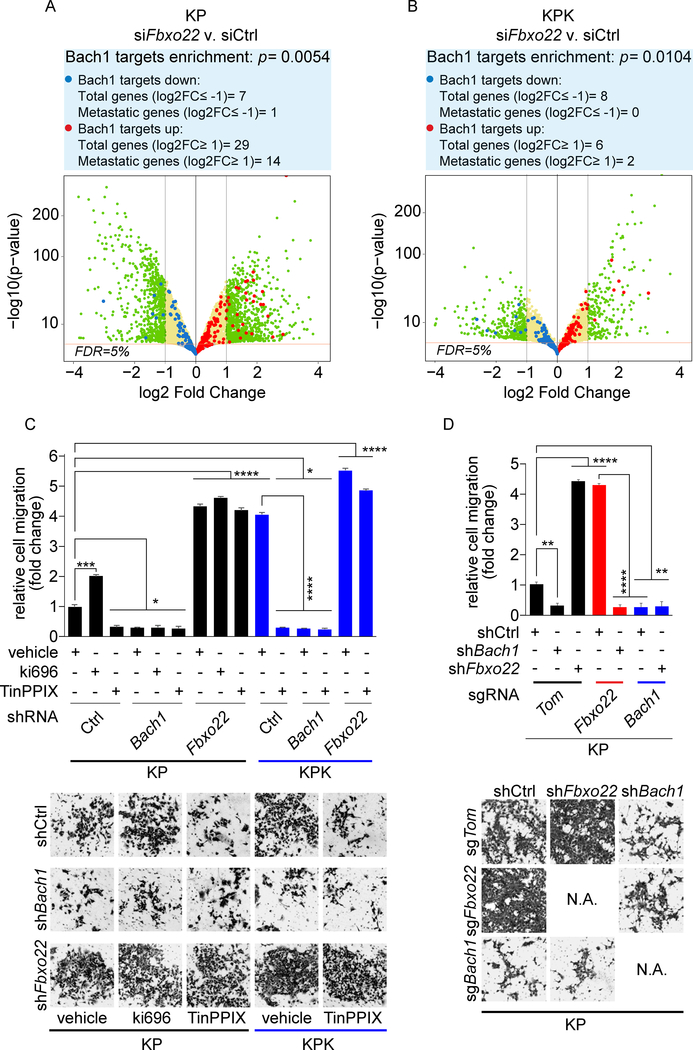
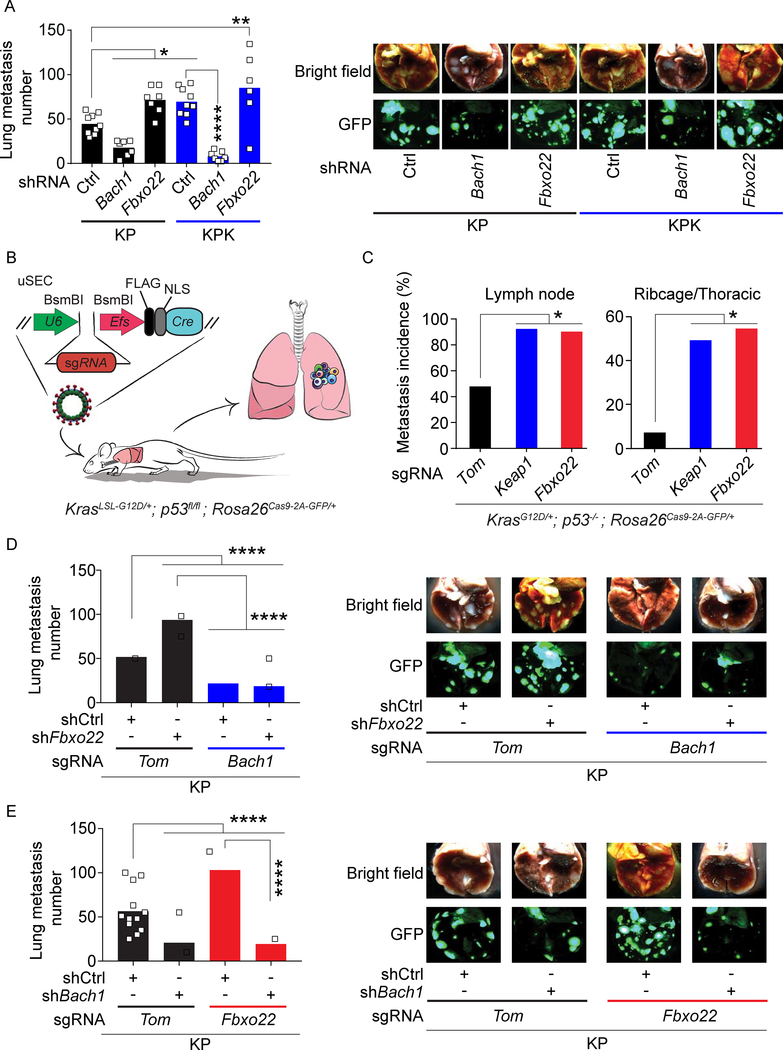
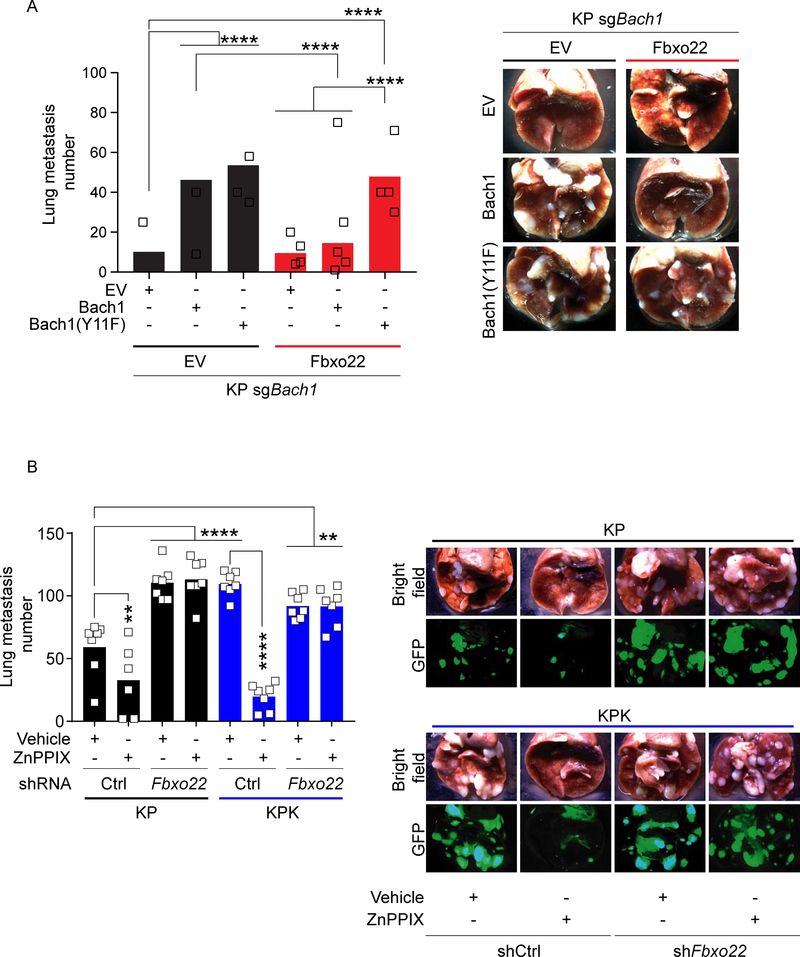
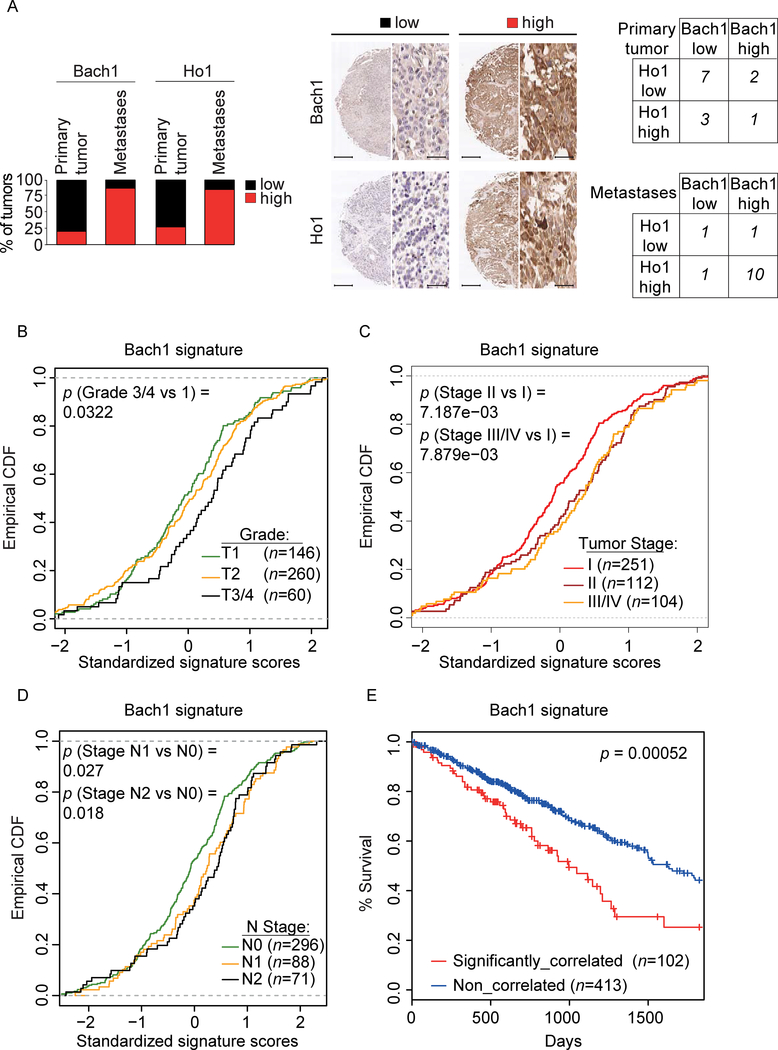
Approximately 30% of human lung cancers acquire mutations in either Keap1 or Nfe2l2, resulting in the stabilization of Nrf2, the Nfe2l2 gene product, which controls oxidative homeostasis. Here, we show that heme triggers the degradation of Bach1, a pro-metastatic transcription factor, by promoting its interaction with the ubiquitin ligase Fbxo22. Nrf2 accumulation in lung cancers causes the stabilization of Bach1 by inducing Ho1, the enzyme catabolizing heme. In mouse models of lung cancers, loss of Keap1 or Fbxo22 induces metastasis in a Bach1-dependent manner. Pharmacological inhibition of Ho1 suppresses metastasis in a Fbxo22-dependent manner. Human metastatic lung cancer display high levels of Ho1 and Bach1. Bach1 transcriptional signature is associated with poor survival and metastasis in lung cancer patients. We propose that Nrf2 activates a metastatic program by inhibiting the heme- and Fbxo22-mediated degradation of Bach1, and that Ho1 inhibitors represent an effective therapeutic strategy to prevent lung cancer metastasis.

Keywords: Bach1; CRL complexes; F-box proteins; Fbxo22; Heme; Ho1 inhibitor; Keap1; Nrf2; cullin-RING ubiquitin ligase; lung cancer; metastasis; ubiquitin.


Conflict of interest statement

Declaration of Interests

M.P. is a member of the advisory boards of Cullgen Inc. and Kymera Therapeutics. He is also a consultant for BeyondSpring Pharmaceuticals.

Figures

Figure 1.
Figure 1.. Keap1 loss promotes cell migration, metastasis, and activation of the Bach1 transcriptional program
(A) Metastasis incidence (thoracic and lymph nodes) in sgTom and sgKeap1 KP mice (n= 9 and 8, respectively) at 21 weeks after infection with pSECC lentiviruses. </p/>(B) Metastasis incidence (thoracic and lymph nodes) upon intratracheal implantation of KPK or KP cells (n= 9 in each group) at moribund or 100 days after implantation. (C) Quantification of lung metastasis at 4 weeks after subcutaneous (SQ) implantation of KPK or KP cells expressing GFP reporter (n= 7 in each group). Data are presented as means, and squares represent individual data points. (D) Representative brightfield and GFP fluorescent images of lung metastasis from (C). </p/>(E) Upregulation of HCMDB genes in KPK v. KP cells. (F) Upregulation of Bach1 transcriptional signature in KPK v. KP cells. (G) A volcano plot comparing the expression of HCMDB genes and Bach1 targets genes between KPK and KP cells. Plotted for each transcript are the negative log10 of the p value and the log2 of the fold change of gene expression of KPK v. KP cells. The red bars represent fold change values of −/+2 and the yellow bar represents an FDR threshold of 5%. Circle data points represent non-metastatic transcripts (non-met); square data points represent metastatic transcripts (met); gray data points represent non-Bach1 target transcripts; green data points represent Bach1 target transcripts. FC, fold change. (H) Correlation plot between protein and mRNA level changes in KPK v. KP cells. For each of 8,586 mRNA fold changes in KPK v. KP cells (x axis, Log2 scale) the associated protein fold change in KPK v. KP cells is plotted (y axis, Log2 scale). The Pearson correlation coefficient (R square) was 0.72. The yellow bars represent a fold change value of +2 for both mRNA and protein levels. Circle data points represent non-metastatic proteo-transcripts; square data points represent metastatic proteo-transcripts; gray data points represent non-Bach1 target proteo-transcripts; green data points represent Bach1 target proteo-transcripts. FC, fold change. (I) Contingency tables demonstrating the correlation between Bach1 and Ho1 protein expression in IHC analyses of mutant-Keap1 v. WT Keap1 biopsies of human LUAD. Keap1 status was confirmed in all tumor samples by targeted exome sequencing. The graph shows the percentage of LUAD biopsies with low or high levels of Bach1 and Ho1. Bach1 and Ho1 levels increase in mutant-Keap1 v. WT Keap1 biopsies: p=0.0006 and p=0.0047 respectively. Right, representative IHC stainings. Scale bars, 100 μM for low magnification (10X) and 25 μM for high magnification (40X).
Figure 2.
Figure 2.. Keap1 loss promotes Bach1 accumulation through Nrf2-dependent induction of Ho1
(A) KP, KPK and Keap1-reconstituted KPK cells were lysed and immunoblotted as indicated. * denotes a nonspecific band. l.ex., long exposure; s.ex., short exposure. (B) KP and KPK cells were treated with CHX, collected at the indicated times, lysed, and immunoblotted as indicated. KP and KPK cells were pretreated with either MG132 or MLN4924 30 minutes before CHX treatment. The graph shows the quantification of Bach1 protein levels. Values are presented as means ±SEM. l.ex., long exposure; s.ex., short exposure. (C) KP-sgTom or 2 different KP-sgNrf2 clones were treated with Ki696, collected at the indicated times, lysed, and immunoblotted as indicated. * denotes a nonspecific band. (D)KP cells were treated with Ki696 for the indicated times. Relative expression levels of Bach1 and Hmox1 genes were determined by qRT-PCR. Values are presented as means ±SD (E) Two different KP-sgTom and KP-sgHo1 clones were treated with Ki696 for 3 hours, collected, lysed and immunoblotted as indicated. (F) The experiment was performed as in (E), except that cells were treated with hemin for the indicated times.
Figure 3.
Figure 3.. Fbxo22 mediates the heme-induced degradation of Bach1
(A)HEK293T cells were transfected with either an empty vector (EV) or the indicated FLAG-tagged proteins. Twenty-four hours post-transfection, cells were treated with MG132 for 3 hours, collected for immunoprecipitation (IP) and immunoblotting. WCE, whole-cell extract. (B)KP and KPK cells were treated with MLN4924 for 3 hours, collected for IP with either nonspecific IgG or with an antibody against Bach1, treated with hemin where indicated, and immunoblotted as indicated. l.ex., long exposure; s.ex., short exposure. (C)A549 cells infected with lentiviruses expressing 2 different shRNAs targeting Fbxo22 (shFbxo22) under the control of a dox-inducible promoter were treated (where indicated) with dox for 24 hours. Cells were then treated with either CHX or hemin, collected at the indicated times, lysed, and immunoblotted as indicated. * denotes a nonspecific band. (D)Two different KP-sgTom and KP-sgFbxo22 clones were treated with hemin, collected at the indicated times, lysed, and immunoblotted as indicated. (E)HEK293T cells were transfected with either an EV or the indicated FLAG-tagged constructs. Twenty-four hours post-transfection, cells were treated with MLN4924 for 3 hours before collection for IP and immunoblotting. WCE, whole-cell extract; l.ex., long exposure; s.ex., short exposure. (F) H2009 cells infected with lentiviruses expressing either a dox-inducible FLAG-tagged WT Bach1 or Bach1(Y11F) were transfected with either an EV or HA-tagged Fbxo22. Cells were treated with dox for 24 hours. Dox was then washed out and, after 4 hours, cells were treated with CHX, collected at the indicated times, lysed, and immunoblotted as indicated. The graph shows the quantification of protein levels. Values are presented as means ±SEM. l.ex., long exposure; s.ex., short exposure.
Figure 4.
Figure 4.. Fbxo22 depletion activates Bach1 transcriptional program and promotes cell migration
(A) Volcano plot comparing the expression of Bach1 signature genes in KP cells transfected with either a non-targeting siRNA (siCtrl) or siFbxo22. Plotted for each gene are the negative log10 of the p value and the log2 of the fold change of gene expression of KP-siFbxo22 cells relative to KP-siCtrl cells. The green dots represent genes with fold change values of −/+ 2, and the red bar represents a FDR threshold of 5%. The blue dots represent down-regulated Bach1 target genes, while the red dots represent upregulated Bach1 target genes. The enrichment of transcripts was calculated considering the transcripts with at least 2 fold change at 5% FDR. (B) The experiment was performed as in (A), except that the volcano plot compares the expression of Bach1 signature genes in KPK-siFbxo22 cells v. KPK-siCtrl cells. (C) KP and KPK cells infected with lentiviruses expressing either a dox-inducible, non-targeting shRNA (shCtrl) or shRNAs targeting either Bach1 (shBach1) or Fbxo22 (shFbxo22). Forty-eight hours after dox induction, cells were treated with either Ki696 or TinPPIX for 24 hours. Cells were then tested for migration in a Boyden chamber assay over a 12 hours period. Next, cells migrated on the bottom of the transwells were fixed, stained and counted in 5 different fields/well. The graph shows quantification from 3 technical replicates of a representative experiment. Bottom, representative images of migrated cells. Values are presented as means ±SEM. (D) KP-sgTom, KP-sgFbxo22, and KP-sgBach1 cells transduced with lentiviruses expressing either a dox-inducible shCtrl, shBach1, or shFbxo22 were treated with dox for 72 hours and tested for migration as in (C). Values are presented as means ±SEM.
Figure 5.
Figure 5.. Bach1 promotes metastasis
(A) Quantification of lung metastases at 4 weeks after SQ implantation of KP and KPK cells expressing a GFP/luciferase reporter and transduced with lentiviruses expressing either a dox-inducible shCtrl, shBach1, or shFbxo22 (from left to right, n= 9, 7, 7, 9, 7, and 6). Mice were put on a dox diet 10 days after implantation. Data are presented as means, and squares represent individual data points. (B) Schematic representation of KrasLSL-G12D/+; p53fl/fl (KP) mice intratracheally infected with uSEC lentiviruses containing sgTom, sgKeap1, or sgFbxo22. (C) Metastasis incidence in sgTom, sgKeap1, or sgFbxo22 mice (n= 12, 10, and 9 respectively) at 21 weeks after infection with uSEC lentiviruses. (D) Quantification of lung metastases at 4 weeks after SQ implantation of KP-sgTom and KP-sgBach1 cells expressing a GFP/luciferase reporter and transduced with lentiviruses expressing either a dox-inducible shCtrl or shFbxo22 (from left to right, n= 12, 13, 13, and 12). Mice were put on a dox diet 10 days after implantation. Data are presented as means, and squares represent individual data points. Right, representative brightfield and GFP fluorescent images of lung metastasis. (E) Quantification of lung metastases at 4 weeks after SQ implantation of KP-sgTom and KP-sgFbxo22 cells expressing a GFP/luciferase reporter and transduced with lentiviruses expressing either a dox-inducible shCtrl or shBach1 (from left to right, n= 12, 15, 15, and 14). Mice were put on a dox diet 10 days after implantation. Data are presented as means, and squares represent individual data points. Right, representative brightfield and GFP fluorescent images of lung metastasis.
Figure 6.
Figure 6.. Fbxo22 overexpression or Ho1 inhibition blocks Bach1-driven metastasis
(A) Quantification of lung metastases at 4 weeks after SQ implantation of KP-sgBach1 cells infected with lentiviruses expressing either EV or Fbxo22 in combination with lentiviruses expressing either a dox-inducible EV, WT Bach1 or Bach1(Y11F) (n=14 in each group). Mice were put on a dox diet 10 days after implantation. Data are presented as means, and squares represent individual data points. Right, representative brightfield images of lung metastases. (B) Quantification of lung metastases at 4 weeks after SQ implantation of KP and KPK cells expressing a GFP/luciferase reporter and infected with lentiviruses expressing either a dox-inducible shCtrl or shFbxo22. Mice were put on a dox diet 10 days after implantation. Two weeks after implantation, mice were randomized and daily injected for 14 days with either vehicle or ZnPPIX 40mg/kg (from left to right, n= 7, 6, 7, 7, 7, 7, 7, and 7). Data are presented as means, and squares represent individual data points. Right, representative brightfield and GFP fluorescent images of lung metastases.
Figure 7.
Figure 7.. Bach1 levels and its transcriptional signature are associated with poor survival, advanced clinical stage and grade, and presence of metastases in human LUAD
(A) The graph shows the percentage of primary human LUAD samples with matching metastasis (n = 13) displaying low or high levels of Bach1 and Ho1. Middle panels, representative IHCs. Scale bars, 330 μM for low magnification (3X) and 25 μM for high magnification (40X). Left, contingency tables demonstrating the correlation between Ho1 and Bach1 expression in primary tumors (top) and matching metastases (bottom). (B) Empirical cumulative distribution function (CDF) plots showing correlation of individual tumors with the Bach1 signature across various tumor grades within the TCGA LUAD cohort. (C)CDF plots showing correlation of individual tumors with the Bach1 signature across various clinical stages within the TCGA LUAD cohort. (D) CDF plots showing the correlation of individual tumors with Bach1 signature in primary tumors within the TCGA LUAD cohort with lymph node metastasis (N1, N2) as compared to cohort with no metastasis (N0). (E) Kaplan–Meier survival curves comparing subjects in the TCGA LUAD cohort stratified by correlation with Bach1 signature. Tumor samples were binned according to their gene expression correlation with Bach1 signature. Subjects harboring the top 20% (n = 102) most correlated tumors exhibited significantly decreased survival as compared to the remaining subjects (n = 413) from the TCGA LUAD cohort.

Comment in

References

    1. Anders S, Pyl PT, and Huber W (2015). HTSeq--a Python framework to work with high-throughput sequencing data. Bioinformatics 31, 166–169. - PMC - PubMed
    1. Bar J, Herbst RS, and Onn A (2008). Multitargeted inhibitors in lung cancer: new clinical data. Clin Lung Cancer 9 Suppl 3, S92–99. - PubMed
    1. Barbie DA, Tamayo P, Boehm JS, Kim SY, Moody SE, Dunn IF, Schinzel AC, Sandy P, Meylan E, Scholl C, et al. (2009). Systematic RNA interference reveals that oncogenic KRAS-driven cancers require TBK1. Nature 462, 108–112. - PMC - PubMed
    1. Benjamini Y, Drai D, Elmer G, Kafkafi N, and Golani I (2001). Controlling the false discovery rate in behavior genetics research. Behav Brain Res 125, 279–284. - PubMed
    1. Bhardwaj A, Yang Y, Ueberheide B, and Smith S (2017). Whole proteome analysis of human tankyrase knockout cells reveals targets of tankyrase-mediated degradation. Nat Commun 8, 2214. - PMC - PubMed

Publication types

MeSH terms