. 2019 Jul 25;178(3):536-551.e14.
doi: 10.1016/j.cell.2019.05.056. Epub 2019 Jun 27.

LC3-Associated Endocytosis Facilitates β-Amyloid Clearance and Mitigates Neurodegeneration in Murine Alzheimer's Disease

Affiliations

LC3-Associated Endocytosis Facilitates β-Amyloid Clearance and Mitigates Neurodegeneration in Murine Alzheimer's Disease

Bradlee L Heckmann et al. Cell. .

Erratum in

Abstract

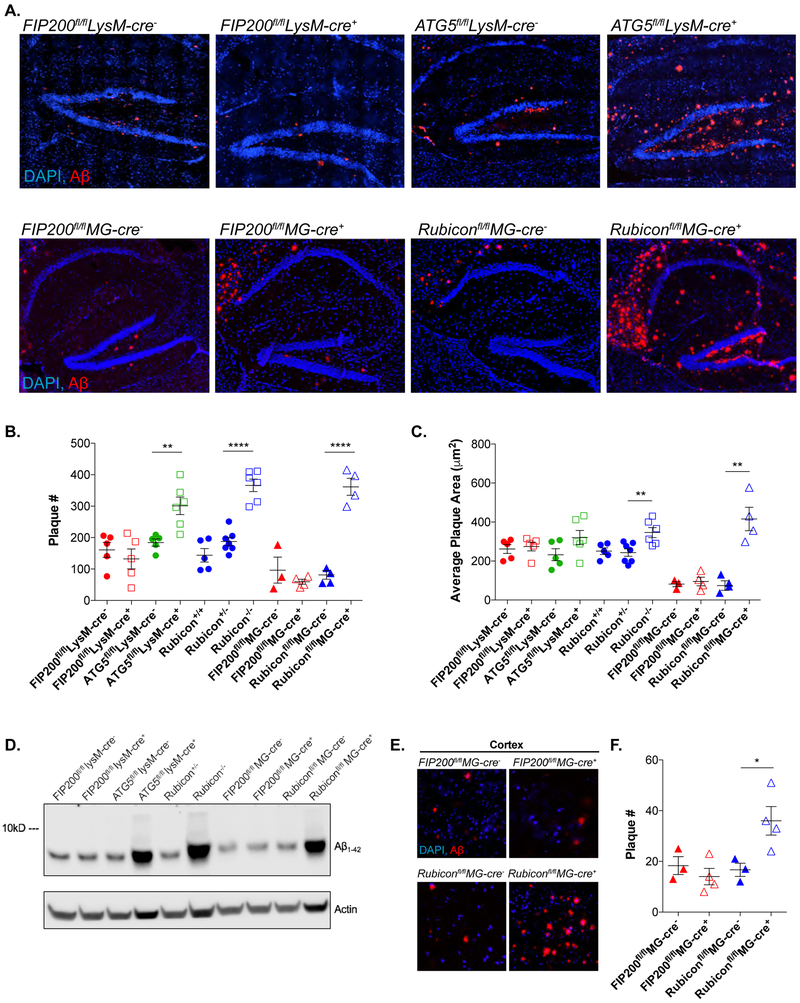
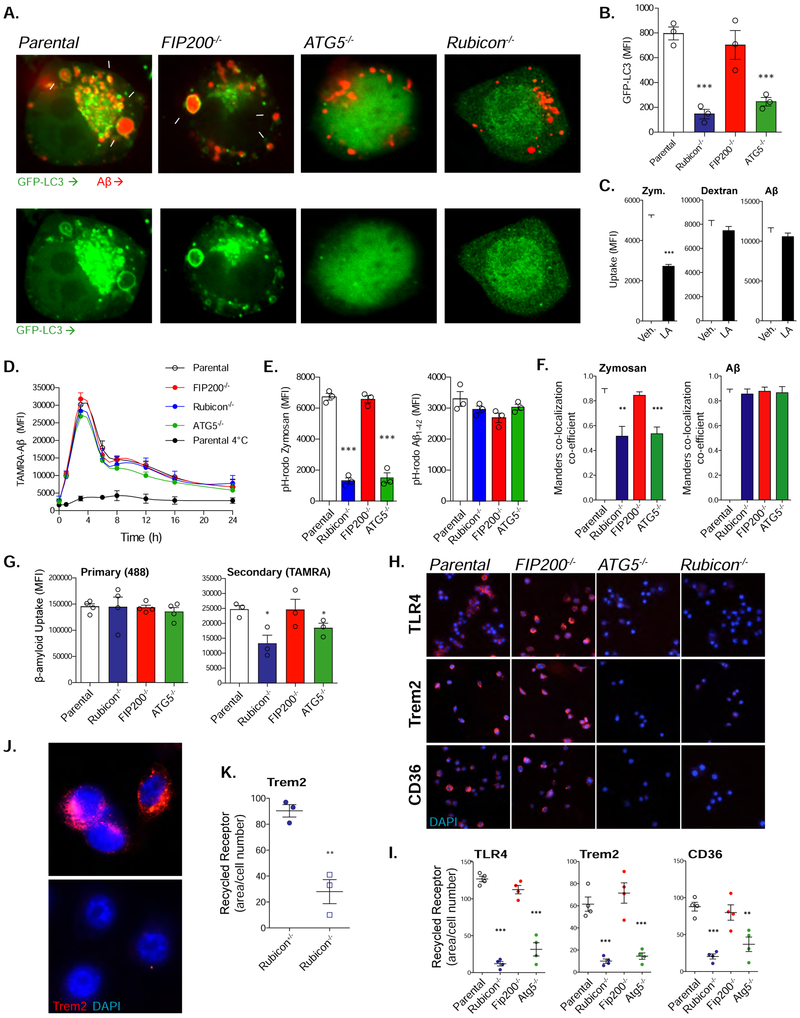
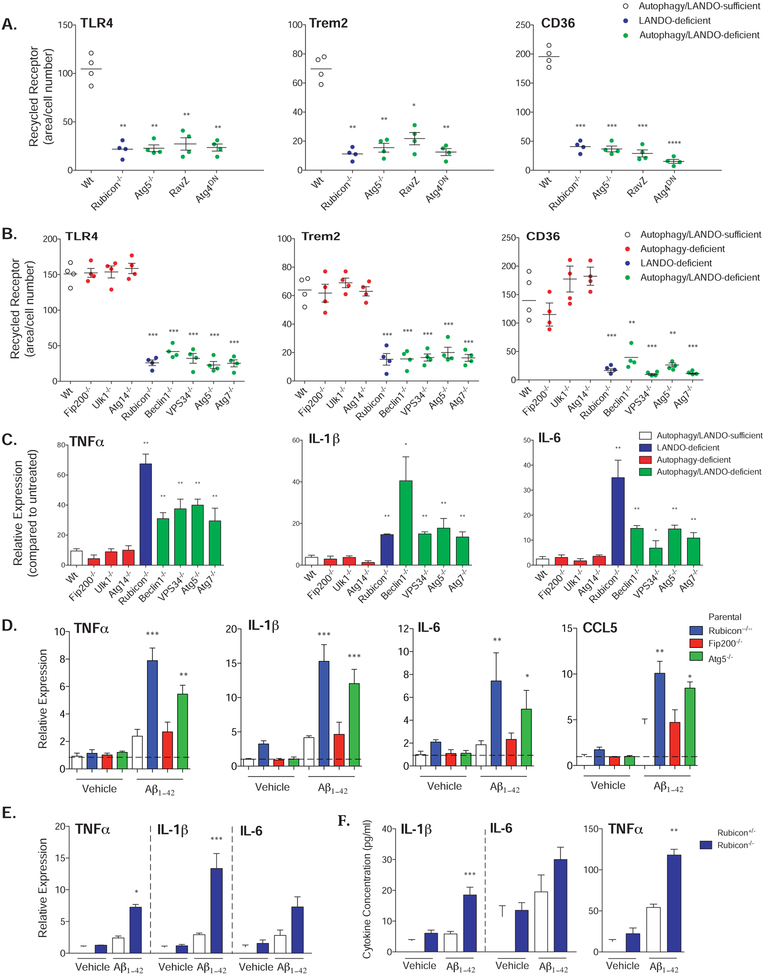
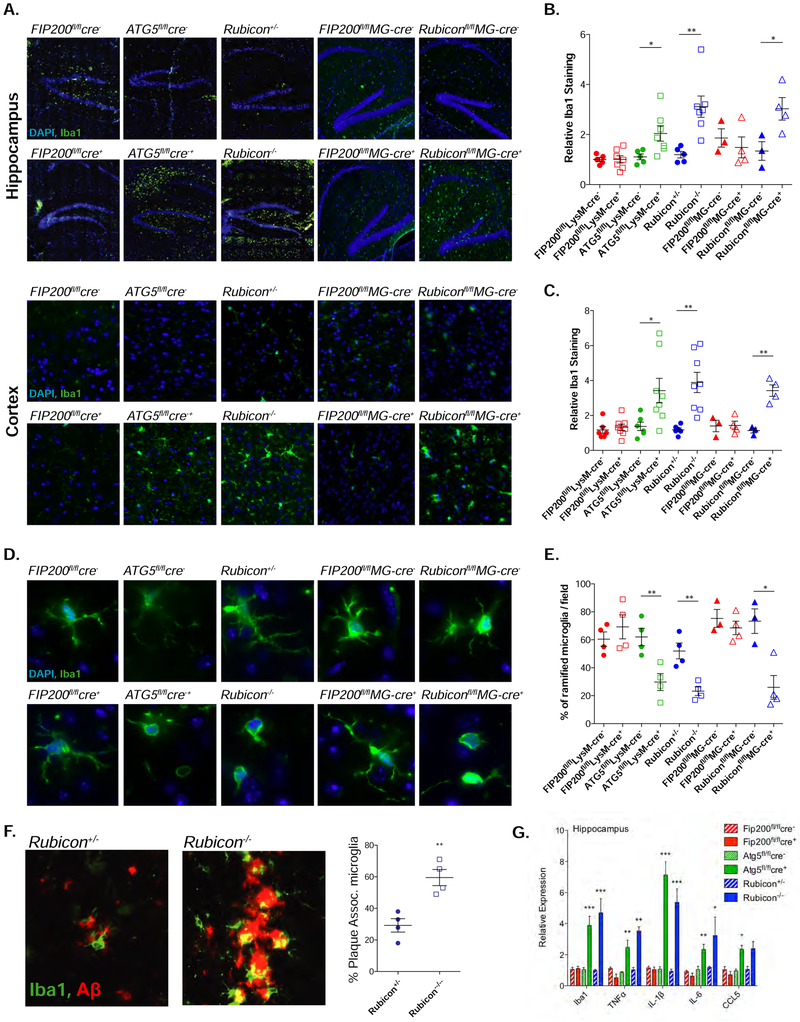
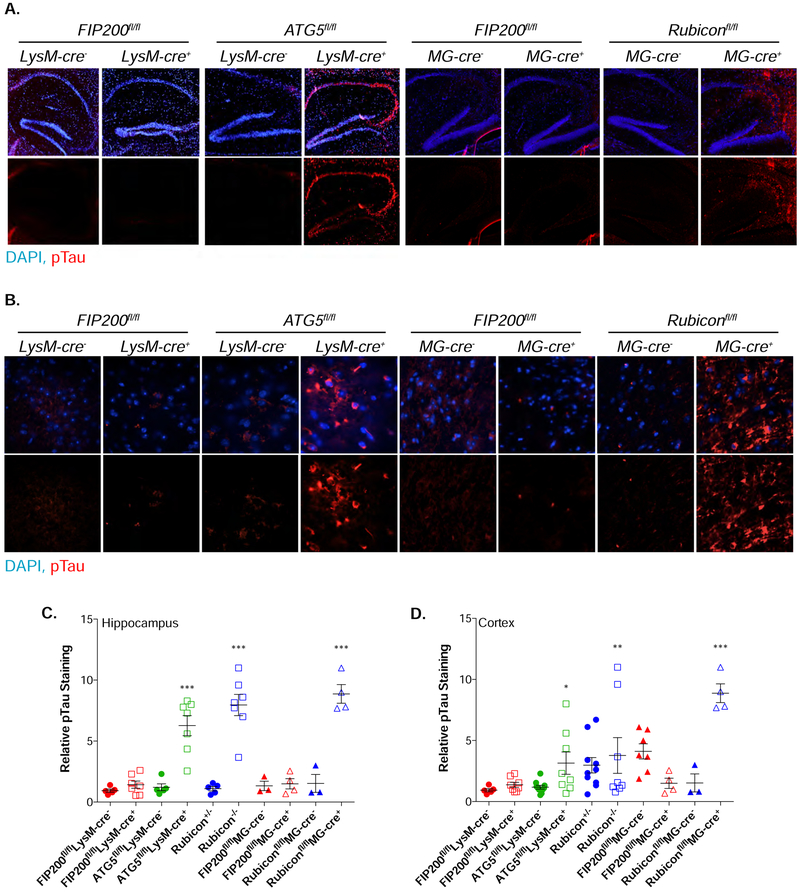
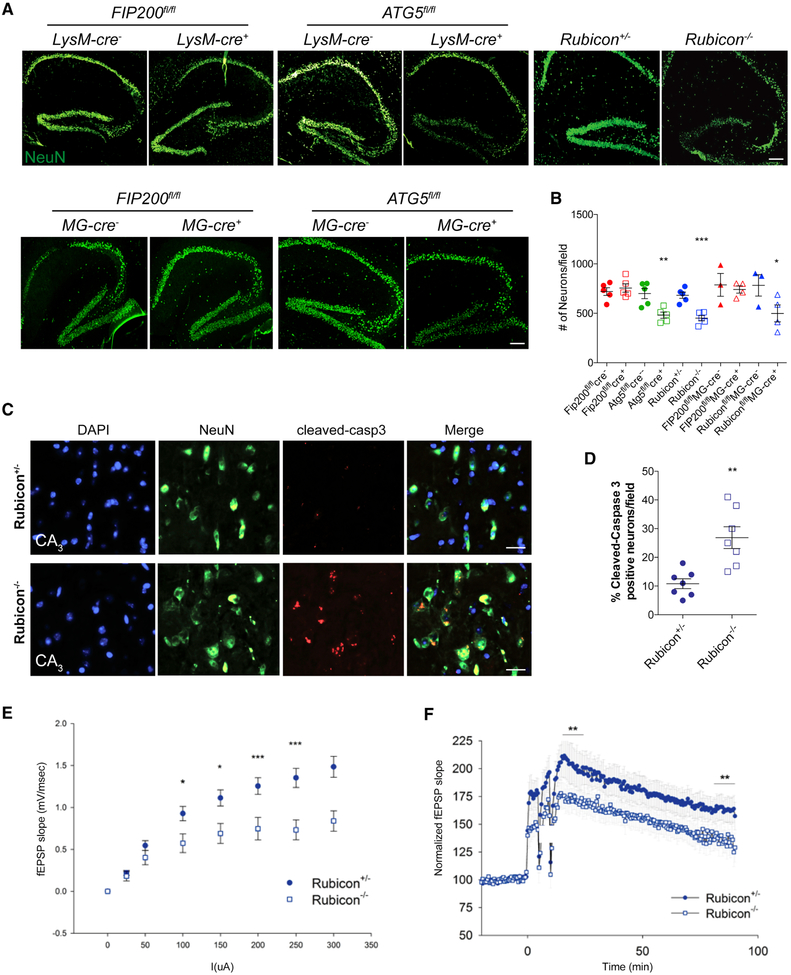
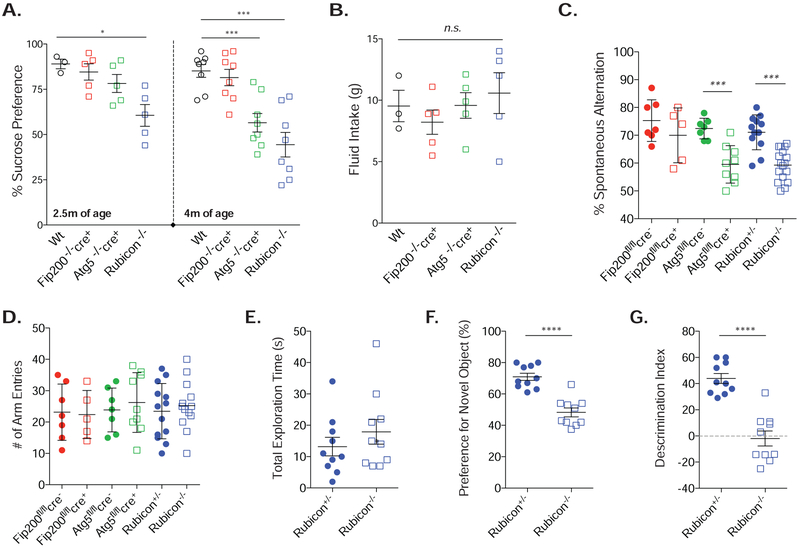
The expression of some proteins in the autophagy pathway declines with age, which may impact neurodegeneration in diseases, including Alzheimer's Disease. We have identified a novel non-canonical function of several autophagy proteins in the conjugation of LC3 to Rab5+, clathrin+ endosomes containing β-amyloid in a process of LC3-associated endocytosis (LANDO). We found that LANDO in microglia is a critical regulator of immune-mediated aggregate removal and microglial activation in a murine model of AD. Mice lacking LANDO but not canonical autophagy in the myeloid compartment or specifically in microglia have a robust increase in pro-inflammatory cytokine production in the hippocampus and increased levels of neurotoxic β-amyloid. This inflammation and β-amyloid deposition were associated with reactive microgliosis and tau hyperphosphorylation. LANDO-deficient AD mice displayed accelerated neurodegeneration, impaired neuronal signaling, and memory deficits. Our data support a protective role for LANDO in microglia in neurodegenerative pathologies resulting from β-amyloid deposition.

Keywords: Alzheimer’s Disease; LC3-associated endocytosis; LC3-associated phagocytosis; autophagy; microglia; neurodegeneration; neuroinflammation; receptor-mediated endocytosis; tau pathology; β-amyloid.


Figures

Figure 1.
Figure 1.. ATG5 and Rubicon-deficiency exacerbates Aβ deposition.
A. Representative images for Aβ (red) in the hippocampus of 4m-old 5xFAD mice with indicated genetic alterations. Scale bars, 100μm B. and C. Quantification of Aβ plaque # (C) and plaque area (D) in the hippocampus of 4m-old 5xFAD mice. Each point represents average quantification from one mouse. D. Whole brain Aβ analysis by immunoblot in 4m-old mice from the indicated 5xFAD genotypes. E. Representative images for Aβ (red) deposition in the 5th cortical layer in 4m-old 5xFAD mice with microglia-specific deletion (MG-cre+) of FIP200 or Rubicon. Scale bars, 50μm. F. Quantification of Aβ plaque # in the cortex of 4m-old 5xFAD, microglia FIP200 or Rubicon-deficient mice. Each point represents average quantification from one mouse. Data are represented as mean ± SEM. Significance was calculated using Student’s t-test. **p<0.01, ****p<0.0001.
Figure 2.
Figure 2.. ATG5 and Rubicon-deficiency impairs LANDO and recycling of Aβ receptors.
A. Representative images showing that GFP-LC3-recruitment to Aβ (red) containing vesicles in BV2 microglia is dependent on ATG5 and Rubicon, but not FIP200. White arrows indicate LC3+ endosomes. Cells were treated with 1μM oligomeric TAMRA-Aβ1-42 for 6h. Scale bars, 5μm. Values are (# of cells containing LC3+, Aβ+ vesicles/100 Aβ-containing cells). B. Quantification of membrane-associated GFP-LC3 in BV2 microglia following 6h stimulation with 1μM oligomeric TAMRA-Aβ1-42. GFP-LC3 was assayed using flow cytometry. Each point represents one independent experiment performed in triplicate. C. Quantification of zymosan (4:1, particle:cell), dextran (500ng/ml), or Aβ (1μM) uptake in BV2 microglia treated with either a vehicle or 50mM latrunculin A (LA). n=3 per condition performed in duplicate. D. Aβ clearance assay performed in BV2 microglia treated with oligomeric TAMRA-Aβ1-42 for 1h. n=4 per genotype performed in duplicate. E. Quantification of fluorescent pH-rodo signal from BV2 microglia of the indicated genotypes stimulated with pH-rodo Zymosan (5:1, particle:cell) or pH-rodo Aβ (1μM) for 3h. n=3 per genotype performed in duplicate. F. Quantification of the co-localization between zymosan or Aβ and LAMP1 labeled lysosomes in BV2 microglia (see Fig. S2F). Cells were treated with zymosan (4:1, particle:cell), or Aβ (1μM) for 3h. n=3 per genotype performed in duplicate. G. Primary and secondary uptake of Aβ measured in BV2 microglia. Each point represents one independent experiment performed in duplicate. H. Representative images of receptor recycling for TLR4, TREM2, and CD36 in BV2 microglia. Scale bars, 50mm. I. Quantification of recycled receptors in BV2 microglia (See STAR Methods). Each point is one independent experiment performed in duplicate. J. Representative images of TREM2 recycling in primary microglia from Rubicon+/− or Rubicon−/− mice. Scale bars, 10μm. K. Quantification of TREM2 recycling in primary microglia from indicated genotypes. Each point is one independent experiment performed in duplicate. Data are represented as mean ± SEM. Significance was calculated using Student’s t-test. *p<0.05, **p<0.01, ***p<0.001.
Figure 3.
Figure 3.. Abrogation of LANDO promotes Aβ-induced inflammation.
A. Quantification of receptor recycling in RAW264.7 cells deficient in the indicated genes as shown or overexpressing RavZ or dominant-negative ATG4 as shown. Each data point represents a unique experiment performed in duplicate. B. Quantification of receptor recycling in BMDMs isolated from the indicated genotypes and for the indicated receptors. Each data point represents a unique experiment performed in duplicate. C. and D. Pro-inflammatory cytokine expression in (C) BMDMs or (D) BV2 microglia in response to 1μM oligomeric Aβ1-42 measured by qPCR. Cells were treated for 12h. For C., n=3 per genotypes performed in duplicate. For D., n=4 per genotype performed in triplicate. E. qPCR analysis of pro-inflammatory gene expression in primary microglia following 1μM oligomeric Aβ1-42 exposure for 12h. n=3 per genotype performed in triplicate. F. Cytokine production by primary microglia in response to 1μM oligomeric Aβ1-42 measured 12h post-incubation by ELISA. n=3 per genotype performed in duplicate. Data are represented as mean ± SEM. Significance was calculated using Student’s t-test. *p<0.05, **p<0.01, ***p<0.001.
Figure 4.
Figure 4.. LANDO decreases Aβ-induced reactive microgliosis
A. Representative images showing microglial activation/expansion (green-Iba1 positive) in the hippocampus and the 5th cortical layer (cortex) of the indicated 4m-old 5xFAD genotypes. Scale bars, 100μm. B. and C. Quantification of activated microglia in the hippocampus (B) and cortex (C) respectively. Data shown is the MFI of Iba1 staining for each genotype relative to Wt, 5xFAD littermate controls. Each point represents an individual mouse. D. Representative images indicating microglial morphology in 4m-old mice. Scale bars, 10μm. E. Quantification of ramified vs. ameboid microglia in the indicated 5xFAD genotypes at 4m of age. Each point represents an individual mouse. F. Representative images and quantification of microglia/plaque-association in 4m-old 5xFAD, Rubicon+/− or Rubicon−/− mice. (See STAR Methods). Each point represents an individual mouse. Scale bars, 5μm. G. qPCR analysis of inflammatory gene expression in hippocampal slices from 4m-old 5xFAD mice of the indicated genotypes. n=7 mice per genotype, qPCR performed in triplicate. Data are represented as mean ± SEM. Significance was calculated using Student’s t-test. *p<0.05, **p<0.01, ***p<0.001.
Figure 5.
Figure 5.. LANDO mitigates tau hyperphosphorylation.
A. and B. Representative images showing phosphorylation of Tau at S202/T205 in the hippocampus (A) and cortex (B) of 4m-old LANDO-deficient 5xFAD mice. Scale bars, 100μm for A, 30μm for B. Upper images are combined DAPI and anti-pTau, lower are anti-pTau only. C. and D. Quantification of phospho-tau in the hippocampus (C) and cortex (D) of the indicated 5xFAD genotypes at 4m of age. The MFI of phospho-tau staining for each genotype is shown as relative to Wt, 5xFAD littermates as described for Iba1 staining (See Fig. 4 legend). Each point represents an individual mouse. Data are represented as mean ± SEM. Significance was calculated using Student’s t-test. *p<0.05, **p<0.01, ***p<0.001.
Figure 6.
Figure 6.. LANDO-deficiency promotes Aβ-induced neuronal death.
A. Representative images showing neurons (NeuN-green) in the hippocampus of the indicated 4m-old 5xFAD genotypes. Scale bars, 100μm. B. Quantification of neuronal content (#) within the hippocampus at 4m of age. Each point represents an individual mouse. C. Representative images identifying neuronal apoptosis within the CA3-region of the hippocampus of 4m-old 5xFAD Rubicon-deficient mice. Scale bars, 30μm. D. Quantification of apoptotic neurons within the hippocampus of 4m-old 5xFAD Rubicon-deficient mice. Each point represents an individual mouse. E. and F. Analysis of hippocampal synaptic transmission (E) and long-term potentiation (F) in 5xFAD Rubicon-deficient mice. n=9 mice per genotype with a minimum of 5 slices per mouse. Data are represented as mean ± SEM. Significance was calculated using Student’s t-test. *p<0.05, **p<0.01, ***p<0.001.
Figure 7.
Figure 7.. Loss of CA3 neurons in LANDO-deficient mice leads to behavior and memory impairment.
A. and B. Sucrose preference test (A) and fluid intake measurement (B) for the indicated 5xFAD genotypes at both 2.5 and 4m of age. Each data point represents an individual mouse. C. and D. Y-maze test for short-term memory measuring spontaneous arm alternation (C) and total arm entries (D) in the indicated 5xFAD genotypes at 4m of age. Each data point represents an individual mouse. E. – G. Analysis of novel object recognition measuring total exploration time (E), preference for the novel object (F), and the ability to discriminate (G) in 4m-old 5xFAD Rubicon+/− or Rubicon−/− mice. Each data point represents an individual mouse. Data are represented as mean ± SEM. Significance was calculated using Student’s t-test. *p<0.05, ***p<0.001, ****p<0.0001.

References

    1. Abram CL, Roberge GL, Hu Y, and Lowell CA (2014). Comparative analysis of the efficiency and specificity of myeloid-Cre deleting strains using ROSA-EYFP reporter mice. J Immunol Methods 408, 89–100. - PMC - PubMed
    1. Aktas O, Ullrich O, Infante-Duarte C, Nitsch R, and Zipp F (2007). Neuronal damage in brain inflammation. Arch Neurol 64, 185–189. - PubMed
    1. Belvindrah R, Nosten-Bertrand M, and Francis F (2014). Neuronal migration and its disorders affecting the CA3 region. Front Cell Neurosci 8, 63. - PMC - PubMed
    1. Bennett ML, Bennett FC, Liddelow SA, Ajami B, Zamanian JL, Fernhoff NB, Mulinyawe SB, Bohlen CJ, Adil A, Tucker A, et al. (2016). New tools for studying microglia in the mouse and human CNS. Proc Natl Acad Sci U S A 113, E1738–1746. - PMC - PubMed
    1. Briones A, Gagno S, Martisova E, Dobarro M, Aisa B, Solas M, Tordera R, and Ramirez M (2012). Stress-induced anhedonia is associated with an increase in Alzheimer's disease-related markers. Br J Pharmacol 165, 897–907. - PMC - PubMed

Publication types

MeSH terms