. 2019 Jul 25;178(3):672-685.e12.
doi: 10.1016/j.cell.2019.05.048. Epub 2019 Jun 27.

Regulation of Energy Expenditure by Brainstem GABA Neurons

Affiliations

Regulation of Energy Expenditure by Brainstem GABA Neurons

Marc Schneeberger et al. Cell. .

Abstract

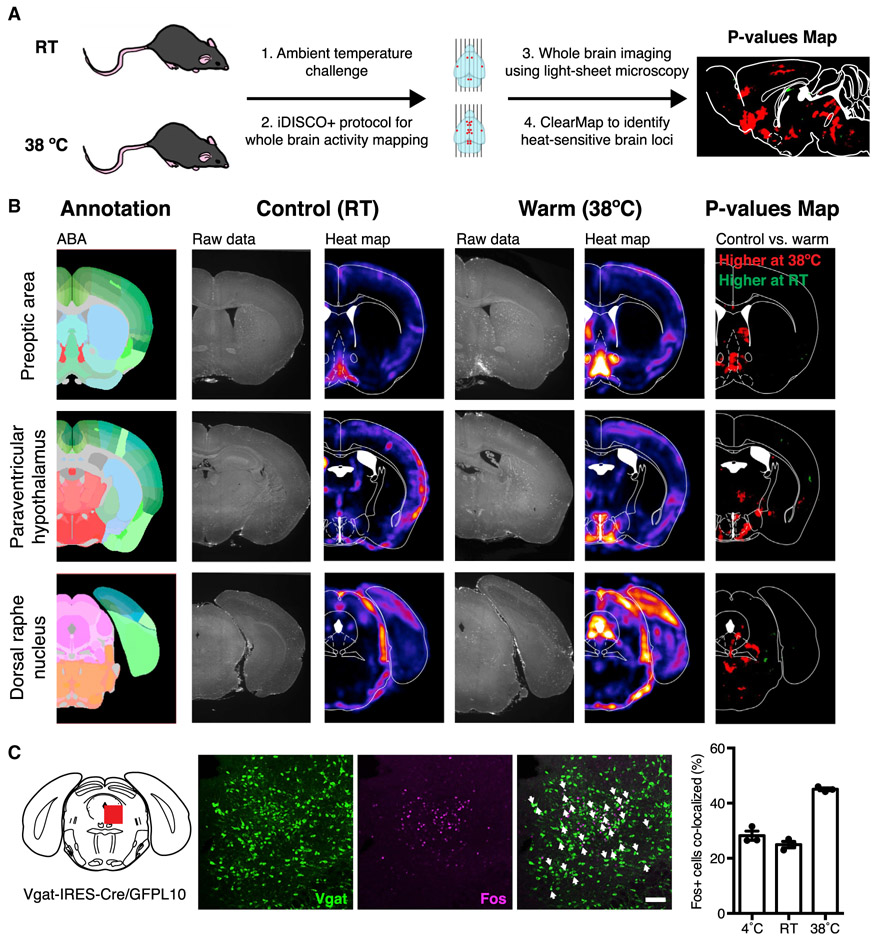
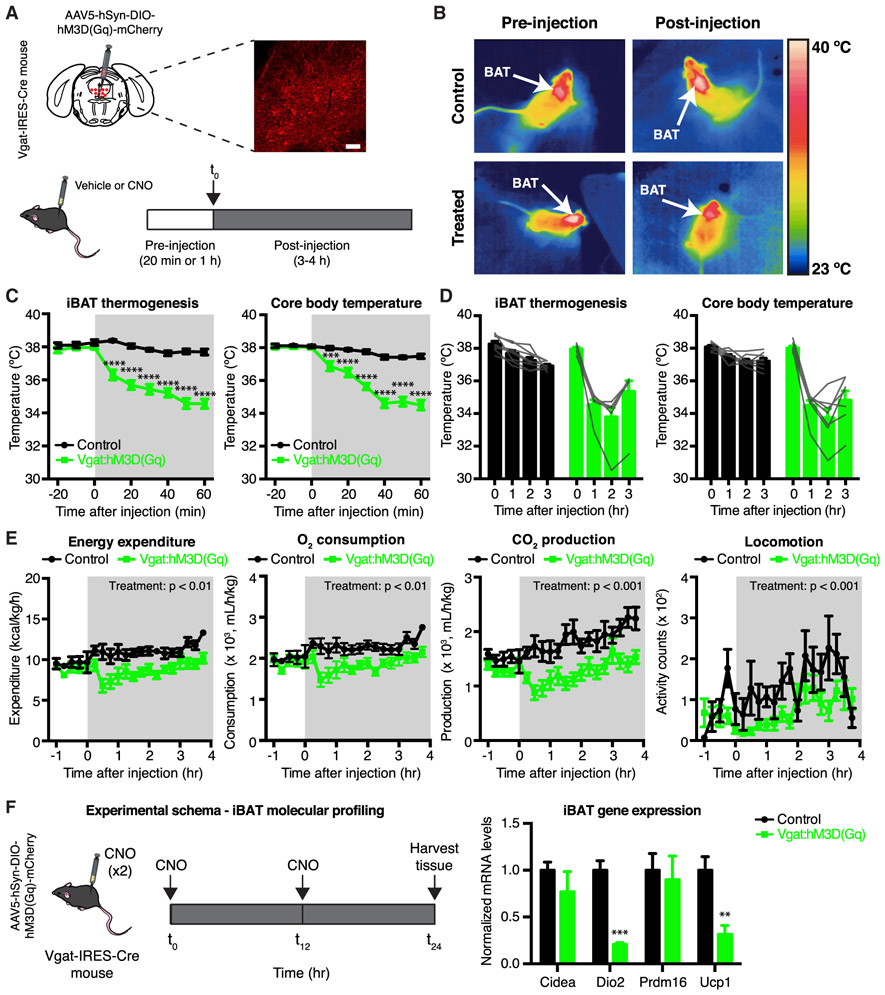
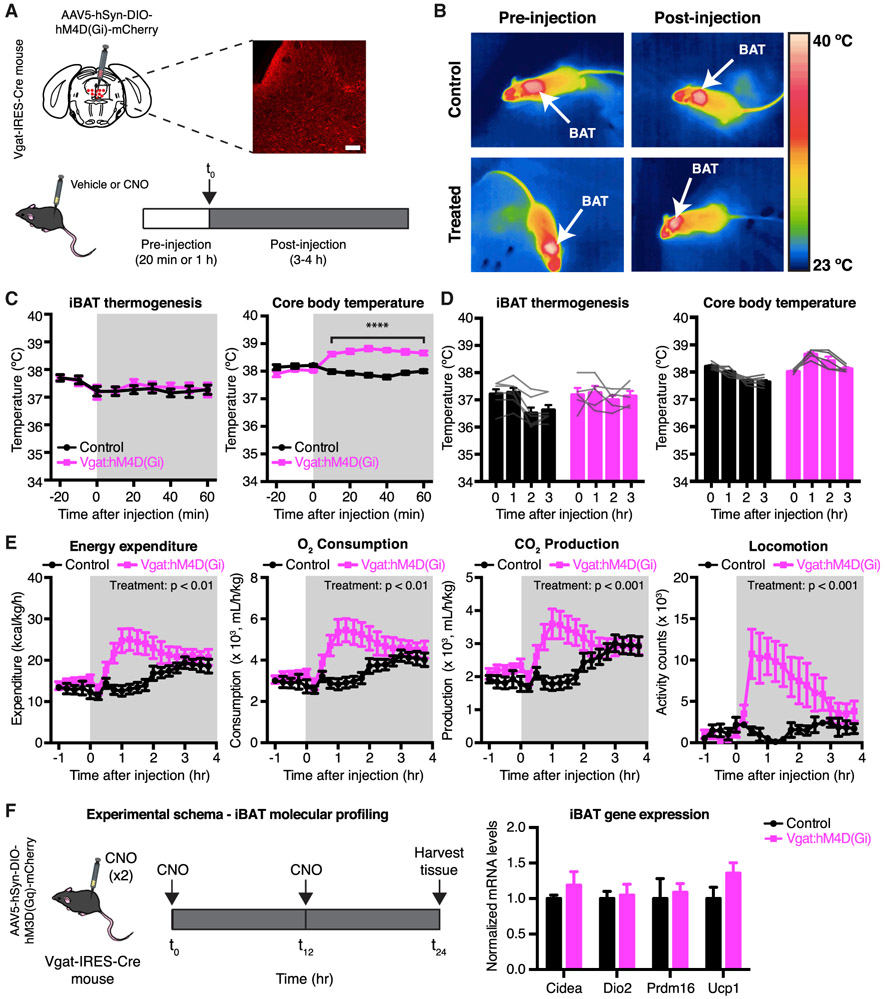
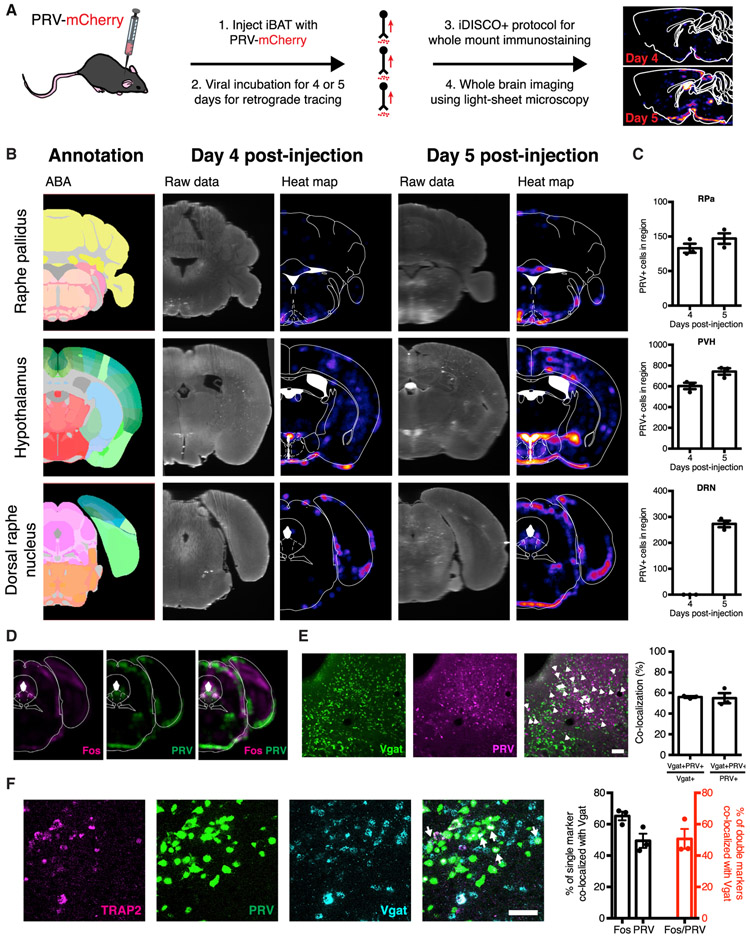
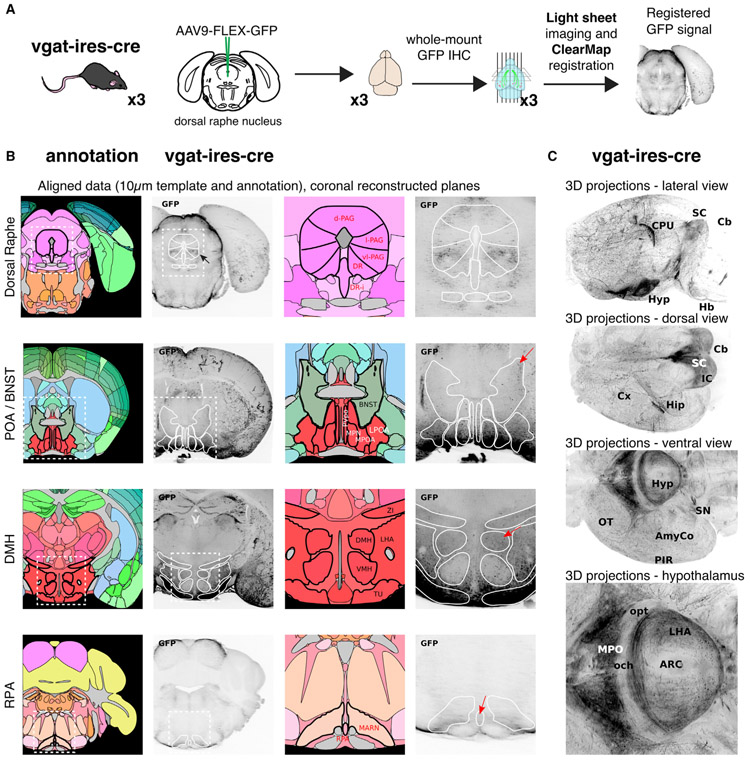
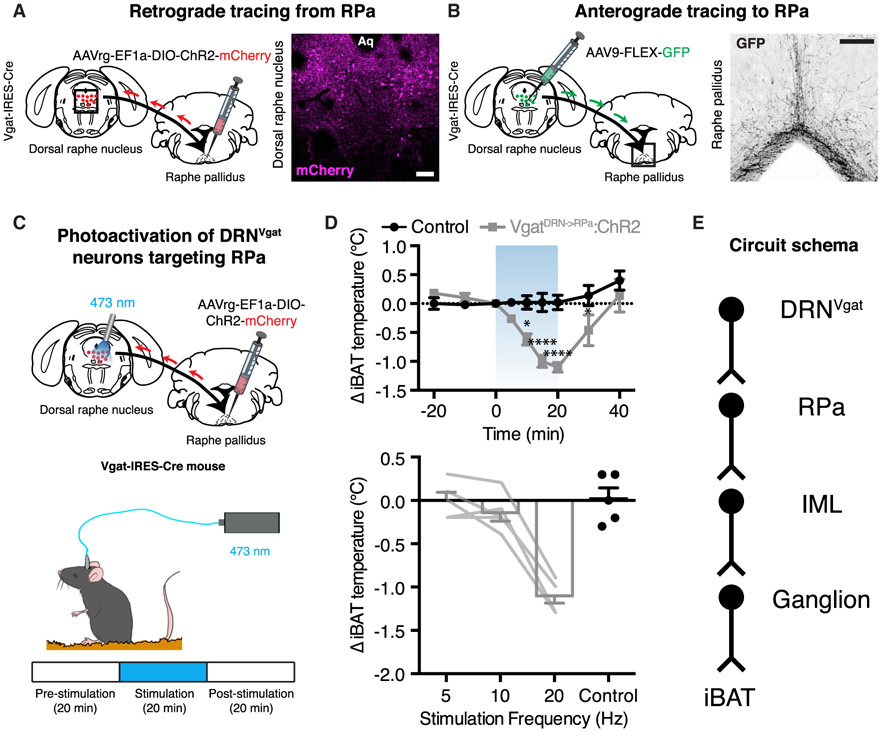
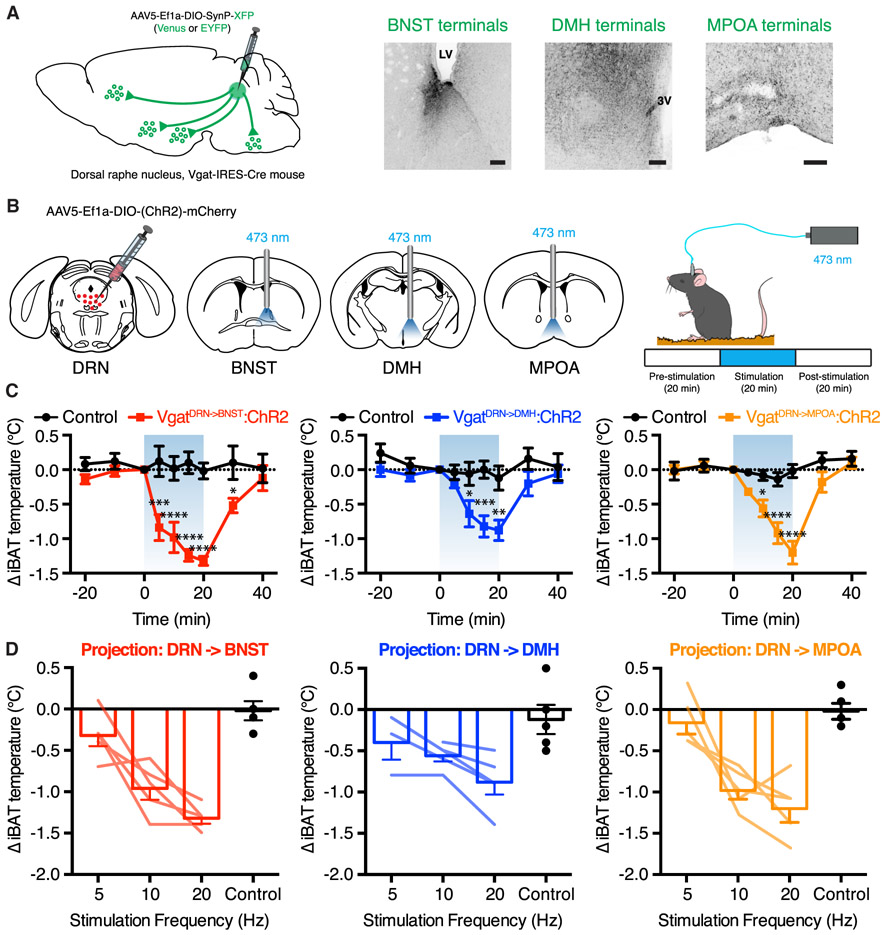
Homeostatic control of core body temperature is essential for survival. Temperature is sensed by specific neurons, in turn eliciting both behavioral (i.e., locomotion) and physiologic (i.e., thermogenesis, vasodilatation) responses. Here, we report that a population of GABAergic (Vgat-expressing) neurons in the dorsolateral portion of the dorsal raphe nucleus (DRN), hereafter DRNVgat neurons, are activated by ambient heat and bidirectionally regulate energy expenditure through changes in both thermogenesis and locomotion. We find that DRNVgat neurons innervate brown fat via a descending projection to the raphe pallidus (RPa). These neurons also densely innervate ascending targets implicated in the central regulation of energy expenditure, including the hypothalamus and extended amygdala. Optogenetic stimulation of different projection targets reveals that DRNVgat neurons are capable of regulating thermogenesis through both a "direct" descending pathway through the RPa and multiple "indirect" ascending pathways. This work establishes a key regulatory role for DRNVgat neurons in controlling energy expenditure.


Conflict of interest statement

DECLARATION OF INTERESTS

The authors declare no competing interests.

Figures

Figure 1.
Figure 1.. Whole-Brain Fos Mapping Identifies Heat-Sensitive Neurons
(A) Schema for whole-brain activity mapping in response to thermal challenge. (B) Whole-brain imaging and ClearMap results for the POA (top), hypothalamus (middle), and DRN (bottom). p values maps display differentially activated brain loci in 38°C versus RT (n = 5 mice per group). (C) Vgat and Fos colocalization after 38°C thermal challenge. Significantly increased Fos and Vgat colocalization was observed at 38°C, compared to room temperature (p < 0.0001). Unpaired t test comparing treatments (n = 3 mice per group). White arrows designate double-labeled cells. Scale bar, 100 mm. Data are presented as mean ± SEM. See also Figure S1 and Table S1.
Figure 2.
Figure 2.. Chemogenetic Activation of DRNVgat Neurons Suppresses Energy Expenditure
(A) Experimental schema and representative IHC for DRNVgat neurons infected with excitatory DREADD hM3D(Gq). (B) Representative thermal images of iBAT (control or Vgat:hM3D(Gq)) before and after injection of CNO. Chemogenetic activation of DRNVgat neurons suppresses iBAT thermogenesis. (C and D) Short- and long-term changes in iBAT and core temperature after chemogenetic activation of DRNVgat neurons. (C) Activation of DRNVgat neurons significantly suppresses iBAT (treatment: p < 0.0001) and core temperature (treatment: p < 0.0001). Two-way repeated measures (RM) ANOVA comparing control and treated groups (n = 7–8 mice per group). (D) Average iBAT and core temperature at 0–3 h post-CNO injection. iBAT (p < 0.0001) and core (p < 0.0001) temperatures remain significantly suppressed 3 h post-CNO injection. Two-way RM ANOVA comparing t = 0 and t = 3 h post-CNO injection (n = 7–8 mice per group). (E) Chemogenetic activation of DRNVgat neurons suppresses locomotor activity (treatment: p < 0.001), oxygen consumption (treatment: p < 0.01), carbon dioxide production (treatment: p < 0.001), and total energy expenditure (treatment: p < 0.01). Two-way RM ANOVA comparing control and treated groups after CNO injection (n = 7–8 mice per group). (F) Molecular profiling of iBAT after chemogenetic activation of DRNVgat neurons. Genes tested: Cidea (p > 0.05), Dio2 (p < 0.001), Prdm16 (p > 0.05), Ucp1 (p < 0.01). Unpaired t tests comparing treatments (n = 4–5 samples per group). Scale bar, 100 μm. **p < 0.01, ***p < 0.001, ****p < 0.0001. Data are presented as mean ± SEM. See also Figure S2.
Figure 3.
Figure 3.. Chemogenetic Inhibition of DRNVgat Neurons Augments Energy Expenditure
(A) Experimental schema and representative IHC for DRNVgat neurons infected with inhibitory DREADD hM4D(Gi). (B) Representative thermal images of iBAT (control or Vgat:hM3D(Gq)) before and after injection of CNO. Chemogenetic inhibition of DRNVgat neurons has no effect on iBAT thermogenesis. (C and D) iBAT and core temperature after chemogenetic inhibition of DRNVgat neurons. (C) Inhibition of DRNVgat neurons has no effect on iBAT temperature (treatment: p > 0.05), but augments core temperature (treatment: p < 0.0001). Two-way RM ANOVA comparing control and treated groups (n = 5–7 mice per group). (D) Average iBAT (p > 0.05) and core temperature (p > 0.05) at 0 and 3 h post-CNO injection. Two-way RM ANOVA comparing t = 0 and t = 3 h post-CNO injection (n = 5–7 mice per group). (E) Chemogenetic inhibition of DRNVgat neurons increases locomotor activity (treatment: p < 0.05), oxygen consumption (treatment: p < 0.05), carbon dioxide production (treatment: p = 0.087), and total energy expenditure (treatment: p < 0.05). Two-way RM ANOVA comparing control and treated groups after CNO injection (n = 7 mice per group). (F) Molecular profiling of iBAT after chemogenetic inhibition of DRNVgat neurons. Genes tested: Cidea, Dio2, Prdm16, Ucp1 (all n.s.). Unpaired t tests comparing treatments (n = 6 samples per group). Scale bar, 100 μm. ****p < 0.0001, n.s., not significant. Data are presented as mean ± SEM. See also Figure S3.
Figure 4.
Figure 4.. DRNVgat Neurons Polysynaptically Project to Brown Fat
(A) Schema for whole-brain mapping of neurons projecting polysynaptically to iBAT. (B) iDISCO+ whole-brain imaging results (raw data and heatmaps) alongside the ABA annotation for the RPa (top), hypothalamus (middle), and DRN (bottom). (C) Cell counts (manual) from brain slices for PRV-infected cellsat 4- and 5-days post-infection of PRV in iBAT. No changes were observed from day 4 to day 5 for RPa (n.s.), while significant increases in cell counts were observed for PVH (p < 0.05) and DRN (p < 0.0001). Unpaired t test comparing treatments (n = 3 mice per group). (D) Regional colocalization (co-registration) between warm-sensitive (Fos-positive at 38°C) and iBAT-projecting (PRV-positive, at day 5 post-injection) neurons within the dorsolateral DRN (left). (E) Colocalization (and quantification) between Vgat and PRV retrogradely labeled from iBAT 5 days post-injection (n = 3 mice per group). White arrows designate double-labeled cells. Scale bar, 100 μm. (F) Cellular colocalization between DRNVgat neurons, tdTomato (warm-sensitive neurons), and EGFP (neurons polysynaptically innervating iBAT). Scale bar, 50 μm. n.s., not significant. Data are presented as mean ± SEM.
Figure 5.
Figure 5.. DRNVgat Neurons Project to Brain Regions Implicated in Regulating Thermogenesis
(A) Schema for whole-brain projection mapping of DRNVgat neurons. (B) Ascending and descending projections from DRNVgat neurons are observed in numerous loci, such as the extended amygdala, hypothalamus, and RPa. Red arrows highlight (top to bottom) BNST, DMH, and RPa. (C) Whole-brain, 3D images of DRNVgat projections throughout the brain from multiple viewpoints. See also Figure S4, Table S2, and Video S1.
Figure 6.
Figure 6.. DRNVgat Neurons Communicate with iBAT through the RPa to Regulate Thermogenesis
(A) Retrograde labeling of DRNVgat neurons from the RPa. (B) Anterograde labeling of RPa from DRNVgat neurons. (C) Schematic for photoactivation of DRNVgat neurons innervating the RPa. (D) Activation of DRNVgat neurons projecting to the RPa significantly suppresses iBAT temperature (top, treatment: p < 0.001) in a scalable fashion (bottom). Two-way RM ANOVA comparing control and treated groups (n = 5 mice per group). Blue-shaded region highlights Laser On epoch. (E) Circuit schema of DRNVgat neurons polysynaptically innervating iBAT through the RPa. Scale bars, 100 μm. *p < 0.05, ****p < 0.0001. Data are presented as mean ± SEM.
Figure 7.
Figure 7.. DRNVgat Neurons Regulate iBAT Thermogenesis through Multiple Ascending Projections
(A) Schema and representative IHC for validation of DRNVgat projections to BNST, DMH, and MPOA. (B) Schema for DRNVgat neuron terminal stimulation. (C and D) Activation of DRNVgat terminals in either the BNST (treatment: p < 0.001), DMH (treatment: p < 0.0001), or MPOA (treatment: p < 0.01) significantly suppresses iBAT temperature (C) in a scalable fashion (D). Two-way RM ANOVA comparing control and treated groups (n = 5 mice per group). Blue-shaded region highlights Laser On epoch. Scale bars, 100 μm. *p < 0.05, **p < 0.01, ***p < 0.001, ****p < 0.0001. Data are presented as mean ± SEM. See also Figures S5 and S6.

Comment in

  • Keeping your cool.
    Lewis S. Lewis S. Nat Rev Neurosci. 2019 Sep;20(9):512-513. doi: 10.1038/s41583-019-0205-6. Nat Rev Neurosci. 2019. PMID: 31312034 No abstract available.
  • Cool(ing) brain stem GABA neurons.
    Piñol RA, Reitman ML. Piñol RA, et al. Cell Res. 2019 Oct;29(10):785-786. doi: 10.1038/s41422-019-0223-y. Cell Res. 2019. PMID: 31471559 Free PMC article. No abstract available.

References

    1. Allen WE, DeNardo LA, Chen MZ, Liu CD, Loh KM, Fenno LE, Ramakrishnan C, Deisseroth K, and Luo L (2017). Thirst-associated preoptic neurons encode an aversive motivational drive. Science 357, 1149–1155. - PMC - PubMed
    1. An JJ, Liao GY, Kinney CE, Sahibzada N, and Xu B (2015). Discrete BDNF Neurons in the Paraventricular Hypothalamus Control Feeding and Energy Expenditure. Cell Metab. 22, 175–188. - PMC - PubMed
    1. Betley JN, Cao ZF, Ritola KD, and Sternson SM (2013). Parallel, redundant circuit organization for homeostatic control of feeding behavior. Cell 155, 1337–1350. - PMC - PubMed
    1. Cannon B, and Nedergaard J (2004). Brown adipose tissue: function and physiological significance. Physiol. Rev 84, 277–359. - PubMed
    1. Dib B, Rompre PP, Amir S, and Shizgal P (1994). Thermogenesis in brown adipose tissue is activated by electrical stimulation of the rat dorsal raphe nucleus. Brain Res. 650, 149–152. - PubMed

Publication types

LinkOut - more resources