. 2019 Jul 25;178(3):686-698.e14.
doi: 10.1016/j.cell.2019.05.054. Epub 2019 Jun 27.

Lipid-Associated Macrophages Control Metabolic Homeostasis in a Trem2-Dependent Manner

Affiliations

Lipid-Associated Macrophages Control Metabolic Homeostasis in a Trem2-Dependent Manner

Diego Adhemar Jaitin et al. Cell. .

Abstract

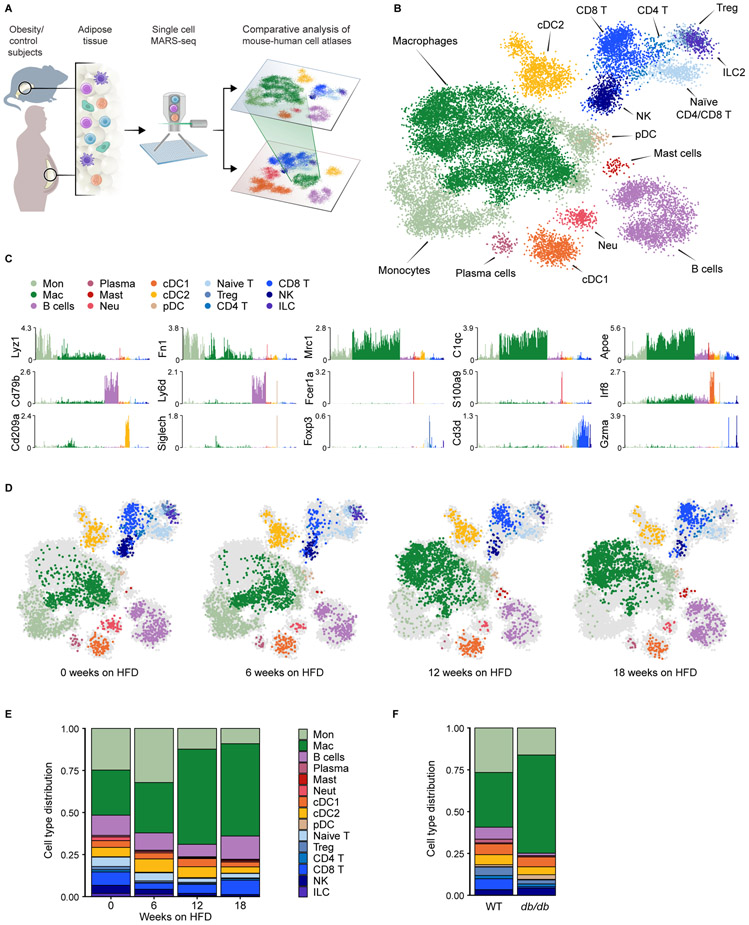
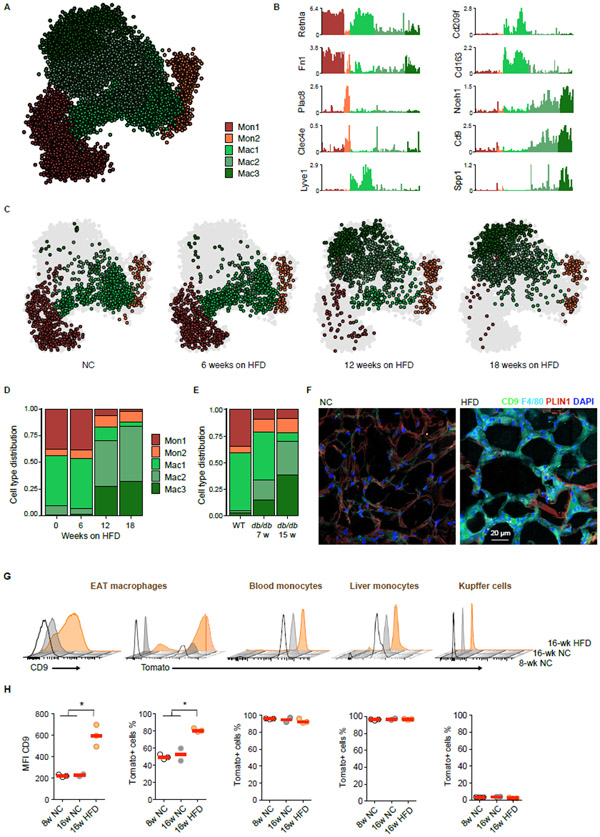
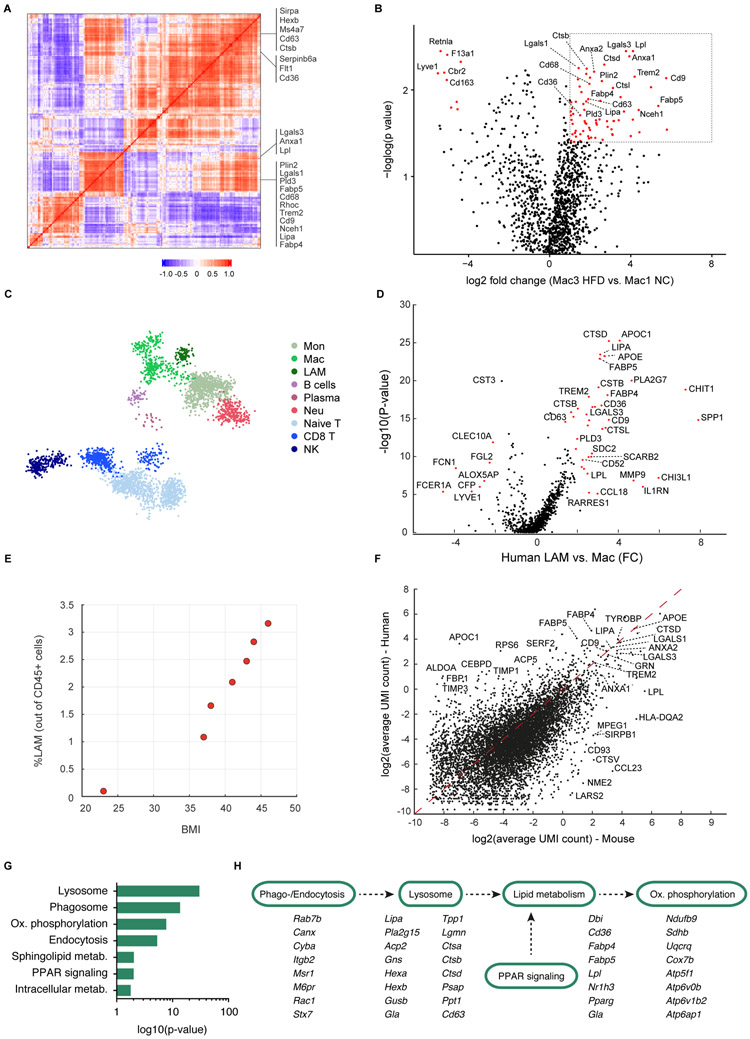
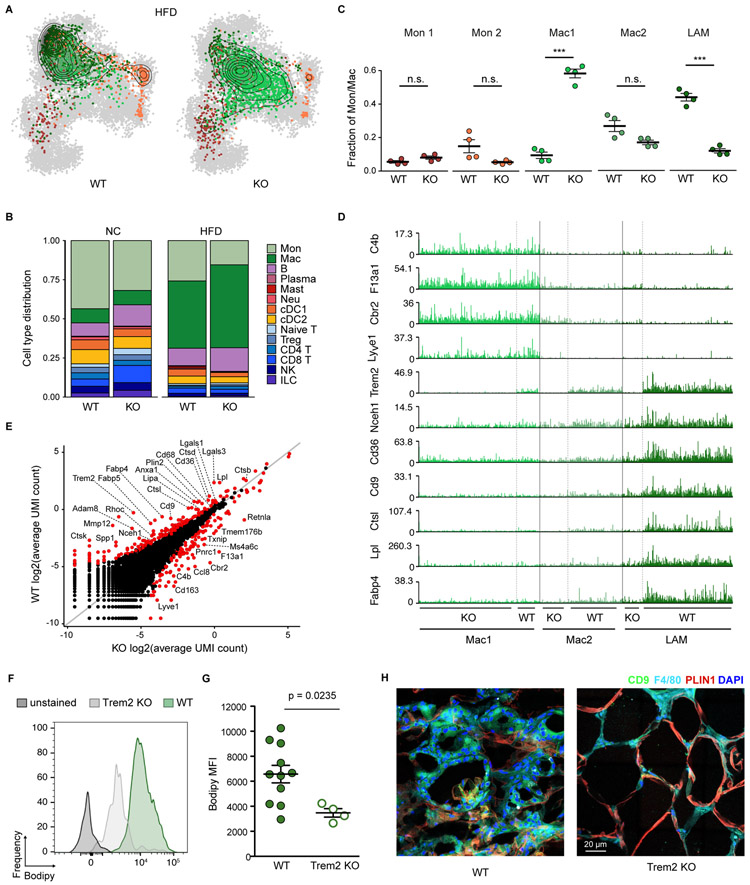
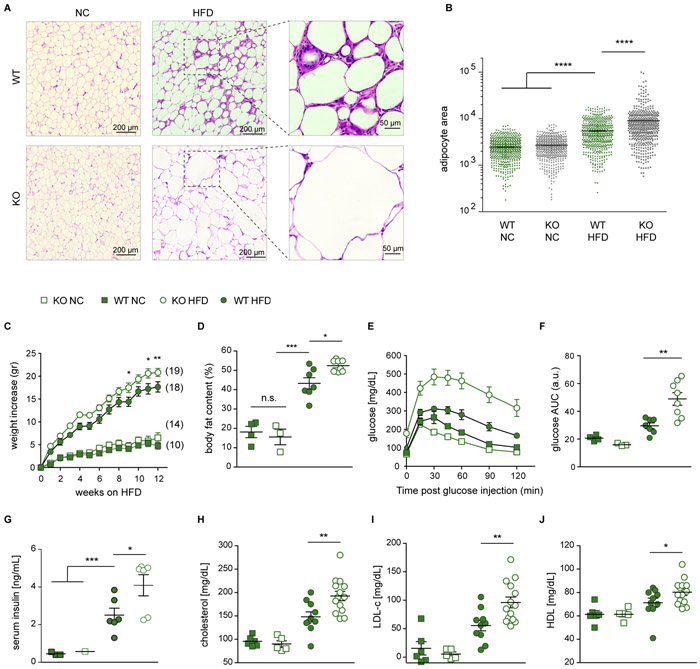
Immune cells residing in white adipose tissue have been highlighted as important factors contributing to the pathogenesis of metabolic diseases, but the molecular regulators that drive adipose tissue immune cell remodeling during obesity remain largely unknown. Using index and transcriptional single-cell sorting, we comprehensively map all adipose tissue immune populations in both mice and humans during obesity. We describe a novel and conserved Trem2+ lipid-associated macrophage (LAM) subset and identify markers, spatial localization, origin, and functional pathways associated with these cells. Genetic ablation of Trem2 in mice globally inhibits the downstream molecular LAM program, leading to adipocyte hypertrophy as well as systemic hypercholesterolemia, body fat accumulation, and glucose intolerance. These findings identify Trem2 signaling as a major pathway by which macrophages respond to loss of tissue-level lipid homeostasis, highlighting Trem2 as a key sensor of metabolic pathologies across multiple tissues and a potential therapeutic target in metabolic diseases.

Keywords: Alzheimer disease; Trem2 pathway; fatty liver diseases; immunology; macrophages; metabolic diseases; metabolism; obesity; single-cell genomics; systems biology.


Conflict of interest statement

Declaration of Interests

A patent application has been filed related to this work.

Figures

Figure 1.
Figure 1.. Single-cell characterization of the adipose tissue immune niche during obesity progression.
A. Schematic of experimental approach: single-cell RNA-seq pipeline of mouse and human adipose tissue immune cells during obesity. B. kNN graph of 21,210 QC-positive immune cells (244 metacells) from EAT of 20 mice fed a normal chow (NC) or high-fat diet (HFD). C. Log2 of average unique molecular identifier (UMI) count of selected genes across metacells. D. kNN graph of EAT immune cells of WT mice on HFD, down-sampled to 2,283 cells (in each condition), annotated as in (B). Each time-point is contributed by either 2 (6 weeks) or 4 mice (12 or 18 weeks) on HFD. E, F. Immune cell type distribution of WT mice on HFD (E), and 7-week old db/db mice and WT littermates (F) of a total of 8,372 QC-positive single cells (75 metacells). See also Figure S1 and Tables S1 and S2.
Figure 2.
Figure 2.. Large changes during obesity in monocyte and macrophage subtypes are mainly characterized by the expansion of a distinct macrophage subset.
A. kNN graph of 11,241 QC-positive immune cells (136 metacells) of the monocyte/macrophage compartment from Figure 1B. B. Shown are Log2 average UMI count of selected genes across metacells of the Monocyte/Macrophage compartment. C. kNN graph of the monocyte/macrophage compartment of WT mice on HFD, downsampled to 1,327 cells (in each condition), annotated as in (A). D. Cell type distribution within the monocyte/macrophage compartment of WT mice on HFD. E. Cell type distribution of 4,988 QC-positive single cells (45 metacells) within the monocyte/macrophage compartment of 7 and 15 week-old db/db mice and WT littermates. F. Representative immunofluorescence images of CD9 (green), F4/80 (cyan) and perilipin-1 (red) in EAT sections of 16-week old WT mice on NC (left), or after 12 weeks on HFD (right). Cell nuclei are stained with DAPI (blue). Scale bar, 20 μm. G. Representative flow cytometry 3D histograms of the CD9 and of the Tomato (Ms4a3 lineage) signals among adipose tissue macrophages, Ly6Chi blood monocytes, Ly6Chi liver monocytes and Kupffer cells from 8 week-old or 16 week-old Ms4a3Cre-Rosa26tdTomato mice fed with NC or HFD for 8 weeks. H. Quantification of the different populations presented in (G). Each dot represents an independent mouse. * p < 0.05 using Student’s t-test. See also Figures S2 and S3.
Figure 3.
Figure 3.. A conserved Trem2 signature characterizes the obesity-related adipose tissue macrophages in mice and humans.
A. Gene-gene Pearson correlation heatmap of 200 most variable genes within the monocyte/macrophage compartment. B. Volcano plot showing the fold change of genes (log2 scale) between the HFD Mac3 to NC Mac1 (x-axis) and their p-value significance (y-axis, −loglog scale). Highly significant genes are indicated by a red dot. p-values were determined by Mann-Whitney U test with FDR correction. See Table S5. C. kNN graph of 15,150 QC-positive single cells (172 metacells) of human omental adipose tissue (OAT). See Table S3. D. Volcano plot of LAM vs Mac1 macrophages fold change in the human OAT (x-axis) and their p-value significance (y-axis). Highly significant genes are indicated by a red dot. p-values were determined by Mann-Whitney U test with FDR correction. See Table S6. E. Percentage of LAM cells in human adipose tissue donors as a function of the donors’ body mass index (BMI). F. Scatterplot showing the average UMI counts (log2 scale) of human LAM (y-axis) compared with the mouse LAM cells (x-axis). G. KEGG pathway analysis of LAM genes shared between mouse and human. H. Pathway visualization for selected genes contributing to the KEGG annotation in (G). See also Figures S4 and S5.
Figure 4.
Figure 4.. Trem2 is essential for adipose tissue macrophage remodeling during obesity.
A. Projection of the monocyte/macrophage compartment onto the kNN graph of Figure 2A for a total of 10,042 QC-positive immune cells (133 metacells) from EAT of Trem2 knock-out(KO) mice or WT littermate controls on HFD. Contour lines indicate the 2D density of projected cells, down-sampled to 2,289 cells (in each condition). See Table S4. B. Immune cell type distribution of WT and Trem2 KO littermates in NC or HFD. C. Frequency of the EAT monocyte/macrophage subsets as defined in Figure 2 in four KO and four WT mice on HFD. D. Expression level (UMI counts) per cell of selected marker genes in the Mac1, Mac2 and LAM populations found in EAT of WT and KO mice. E. Scatterplot showing the average molecule (UMI) count (log2 scale) of KO (x-axis) compared to WT macrophages (y-axis) in 732 cells from each group, randomly down-sampled from the area of highest density in (A) for equal cell numbers. F. Bodipy signal histograms from CD9+CD63+ adipose tissue macrophages of representative Trem2 WT (green) and Trem2 KO (light gray) mice. G. Analysis of intracellular neutral lipid accumulation by Bodipy MFI in adipose tissue macrophages of Trem2 WT and KO mice. Data are presented as mean ± SEM. P-value indicated was obtained using the Student’s t-test. H. Representative immunofluorescence images of CD9 (green), F4/80 (cyan) and perilipin-1 (red) in EAT sections from Trem2 WT mice (left) and Trem2 KO (right) 12 weeks on HFD. Cell nuclei are shown in blue (DAPI). Scale bar, 20 μm. See also Figure S6.
Figure 5.
Figure 5.. Trem2 prevents adipocyte hypertrophy and loss of systemic metabolic homeostasis.
A. Representative images of hematoxylin and eosin (H&E) stain of fixated EAT sections. Scale bars, 200 μm, and 50 μm for HFD sections zoomed in areas. B. Area quantification of 500 adipocytes per genotype/diet tissue sections from photos taken to H&E sections. Bars indicate mean ± SEM. **** p < 0.0001 by one-way ANOVA. C. Weight gain over time on HFD. Number of mice in each group is indicated next to each curve. Filled symbols, Trem2 WT; open symbols, Trem2 KO; squares, mice on normal chow (NC); circles, mice on HFD. Data are presented as mean ± SEM. * p < 0.05; ** p < 0.01 by two-way ANOVA. D. Percentage of body fat content. Bars indicate mean ± SEM. * p < 0.05; *** p < 0.001; n.s., non-significant. E. Glucose tolerance test was performed at fasted mice on week 11 of HFD. F. Area under the curve (AUC) as a measure of glucose intolerance, calculated for each individual mouse in (E). Bars indicate mean ± SEM. ** p < 0.01. G. Fasting insulin concentration in the blood of Trem2 cohorts at week 15 on HFD or NC control. Bars indicate mean ± SEM. * p < 0.05; *** p < 0.001. H-J. Total cholesterol (H), LDL (I), and HDL (J) levels in mouse serum from Trem2 cohorts at week 12 on HFD or NC control. Bars indicate mean ± SEM. * p < 0.05; ** p < 0.01. See also Figure S7.

References

    1. Bahary N, Leibel RL, Joseph L, and Friedman JM (1990). Molecular mapping of the mouse db mutation. Proc Natl Acad Sci U S A 87, 8642–8646. - PMC - PubMed
    1. Baran Y, Sebe-Pedros A, Lubling Y, Giladi A, Chomsky E, Meir Z, Hoichman M, Lifshitz A, and Tanay A (2018). MetaCell: analysis of single cell RNA-seq data using k-NN graph partitions. bioRxiv. - PMC - PubMed
    1. Biswas SK, and Mantovani A (2012). Orchestration of metabolism by macrophages. Cell metabolism 15, 432–437. - PubMed
    1. Boulenouar S, Michelet X, Duquette D, Alvarez D, Hogan AE, Dold C, O'Connor D, Stutte S, Tavakkoli A, Winters D, et al. (2017). Adipose Type One Innate Lymphoid Cells Regulate Macrophage Homeostasis through Targeted Cytotoxicity. Immunity 46, 273–286. - PubMed
    1. Cai D (2013). Neuroinflammation and neurodegeneration in overnutrition-induced diseases. Trends Endocrinol Metab 24, 40–47. - PMC - PubMed

Publication types

MeSH terms