. 2019 Sep 10;13(3):545-558.
doi: 10.1016/j.stemcr.2019.05.027. Epub 2019 Jun 27.

Bmi1 Suppresses Adipogenesis in the Hematopoietic Stem Cell Niche

Affiliations

Bmi1 Suppresses Adipogenesis in the Hematopoietic Stem Cell Niche

Tianyuan Hu et al. Stem Cell Reports. .

Abstract

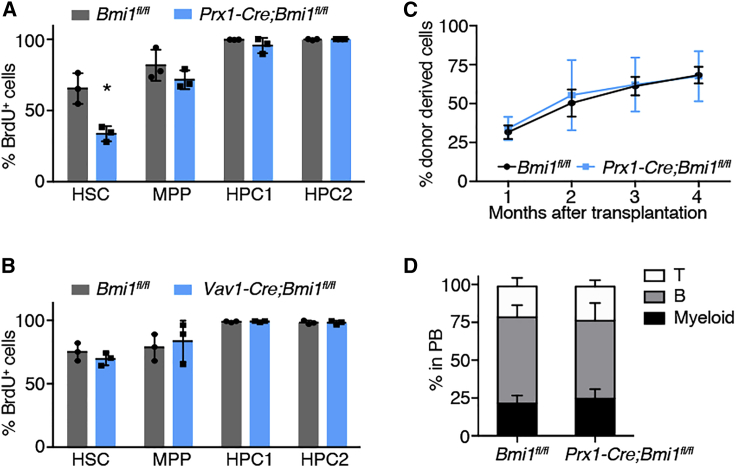
Bone marrow stromal cells (BMSCs) that express high levels of stem cell factor (SCF) and CXC chemokine ligand 12 (CXCL12) are one crucial component of the hematopoietic stem cell (HSC) niche. While the secreted factors produced by BMSCs to support HSCs have been well described, little is known regarding the transcriptional regulators controlling the cell fate of BMSCs and thus indirectly maintaining HSCs. BMI1 is a polycomb group protein that regulates HSCs both cell intrinsically and extrinsically, but it is unknown in which cell type and how BMI1 functions to maintain HSCs extrinsically. Here we show that Bmi1 maintains HSCs by preventing adipogenic differentiation of BMSCs. Bmi1 is highly expressed in BMSCs but becomes downregulated upon adipogenic differentiation and during aging. Deleting Bmi1 from BMSCs increased marrow adipocytes, induced HSC quiescence and depletion, and impaired hematopoiesis. We found that BMI1 repressed multiple developmental programs in BMSCs by safeguarding the repressive epigenetic marks histone H2A ubiquitylation and H3 lysine 27 trimethylation. We identified a novel adipogenic program governed by Pax3, which BMI1 repressed in BMSCs. Our results establish Bmi1 as a critical regulator of BMSC cell fate that suppresses marrow adipogenesis to create a supportive niche for HSCs.

Keywords: BMI1; PAX3; adipocytes; epigenetics; hematopoietic stem cells; mesenchymal stromal cells; niche; polycomb.


Figures

None
Graphical abstract
Figure 1
Figure 1
Bmi1 Is Highly Expressed in BMSCs and Suppresses Senescence (A) Schematic showing the gating strategy to isolate BMSCs (CD140a+CD45Ter119), non-BMSC stroma cells (CD140aCD45Ter119), and hematopoietic cells (CD45+/Ter119+). (B and C) qPCR showing the expression of HSC niche factors and regulators (B) and Bmi1 (C) in BMSCs, other stroma cells, and hematopoietic cells (Hem) (n = 3). (D) Bmi1 expression 3 weeks after osteogenic stimulation (left) and adipocytic induction (right) (n = 7–9). (E) qPCR of Bmi1 expression in purified BMSCs and HSCs from Prx1-Cre;Bmi1fl/fl mice (n = 3–4). (F) The frequencies (left) and total numbers (right) of BMSCs in Bmi1fl/fl and Prx1-Cre;Bmi1fl/fl mice (n = 6). (G) The numbers of CFU-F per 1 × 106 bone marrow cells following Bmi1 deletion (n = 6). (H) Passaging of Bmi1fl/fl and Prx1-Cre;Bmi1fl/fl BMSCs (n = 5). (I and J) The frequencies of SAβ-gal+ cells (n = 5) (I) and expression of Ink4a as determined by qPCR in Bmi1fl/fl and Prx1-Cre;Bmi1fl/fl BMSCs (normalized to 18S rRNA) (J) (n = 3). In (B–E), expression values were normalized to β-actin. All data represent mean ± standard deviation (SD). p < 0.05, ∗∗p < 0.01, and ∗∗∗p < 0.001 by Student's t test. ns, not significant. See also Figure S1.
Figure 2
Figure 2
Bmi1 Deletion from BMSCs Increased Adipogenesis In Vitro (A and B) Representative images showing reduced osteogenesis (A) and increased adipogenesis (B) in Prx1-Cre;Bmi1fl/fl BMSCs upon in vitro induction (n = 3). (C) Expression of adipogenic genes (Pparg, Fabp4, and Adipoq, normalized to 18S rRNA) in Bmi1fl/fl and Prx1-Cre;Bmi1fl/fl BMSCs (n = 5–7) 3 weeks after induction (n = 5), as determined by qPCR. (D) Osteogenic gene (Osterix and Runx2, normalized to 18S rRNA) expression in Bmi1fl/fl and Prx1-Cre;Bmi1fl/fl BMSCs (n = 3). All data represent mean ± SD. p < 0.05, ∗∗p < 0.01, and ∗∗∗p < 0.001 by Student's t test. See also Figure S2.
Figure 3
Figure 3
Bmi1 Deletion from BMSCs Increased Adipogenesis In Vivo (A and B) μCT analyses of the cortical and trabecular bone thickness (A) and bone volume/total volume ratio (BV/TV) (B) (n = 6). (C) Representative μCT image of femurs stained with osmium tetroxide. (D) Quantification of the adipocyte volume to total volume ratio in 2-month-old Bmi1fl/fl and Prx1-Cre;Bmi1fl/fl mice (n = 3). (E) Representative images of femur sections stained with osmium tetroxide (n = 4). (F) Bmi1 expression (normalized to 18S rRNA) in BMSCs isolated from aged mice (18–24 months old, n = 4) compared with those isolated from young mice (2–4 months old, n = 5). Mice of both sexes were analyzed, with representative images from female mice shown. All data represent mean ± SD. p < 0.05, ∗∗p < 0.01, and ∗∗∗p < 0.001 by Student's t test. ns, not significant. See also Figure S3.
Figure 4
Figure 4
Deletion of Bmi1 from BMSCs Impairs Steady-State Hematopoiesis (A) Bone marrow (BM) cellularity in 2- and 6-month-old Bmi1fl/fl and Prx1-Cre;Bmi1fl/fl mice (n = 3–4). (B–H) Absolute numbers of CD150+CD48lineageSca-1+c-kit+ HSCs (B), LT-HSCs (CD34Flt3lineageSca-1+c-kit+ cells), and ST-HSCs (CD34+Flt3lineageSca-1+c-kit+ cells) (C), MPPs (D), CMPs (E), GMPs (F), MEPs (G), and CLPs (H) in Bmi1fl/fl and Prx1-Cre;Bmi1fl/fl mice at 2 and 6 months (n = 4). Data in (C) are from 6-month-old mice. (I–M) Total numbers of hematopoietic colonies (CFU-C) formed from bone marrow cells of hind limbs (n = 3) (I). White blood cell (WBC) (J), red blood cell (RBC) (K), and platelet (PLT) (L) counts, and lineage distribution (M) in the peripheral blood (PB) of Bmi1fl/fl (Ctrl) and Prx1-Cre;Bmi1fl/fl (KO) mice at 2 and 6 months (n = 4). (N) Numbers of hematopoietic colonies formed per 200,000 cells isolated from the spleen and liver (n = 3). Mice of both sexes were used. All data represent mean ± SD. p < 0.05, ∗∗p < 0.01, and ∗∗∗p < 0.001 by Student's t test. ns, not significant. See also Figure S4.
Figure 5
Figure 5
Deletion of Bmi1 from BMSCs Causes Quiescence of HSCs (A) Incorporation of BrdU during a 7-day pulse into HSC, MPP, HPC1, and HPC2 of Bmi1fl/fl and Prx1-Cre;Bmi1fl/fl mice (n = 3). (B) BrdU incorporation into HSCs, MPPs, HPC1, and HPC2 in Bmi1fl/fl and Vav1-Cre;Bmi1fl/fl mice (n = 3). (C and D) Long-term reconstitution assays with 50 HSCs isolated from Bmi1fl/fl or Prx1-Cre;Bmi1fl/fl mice (n = 3) (C). Lineage contribution from transplanted HSCs at 16 weeks after transplantation (n = 3) (D). All data represent mean ± SD. p < 0.05, ∗∗p < 0.01, and ∗∗∗p < 0.001 by Student's t test.
Figure 6
Figure 6
Bmi1 Deletion Derepresses Developmental Programs in BMSCs (A) Differentially expressed genes in BMSCs compared with whole bone marrow cells (n = 3). (B and C) GSEA (B) and GO analysis (C) of Prx1-Cre;Bmi1fl/fl BMSCs compared with Bmi1fl/fl BMSCs (n = 3). NES, normalized enrichment score; FDR, false discovery rate. (D) Differentially expressed genes in Prx1-Cre;Bmi1fl/fl BMSCs compared with Bmi1fl/fl BMSCs (n = 3). (E and F) Pairwise GSEAs testing the enrichment of genes upregulated (E) or downregulated (F) in Prx1-Cre;Bmi1fl/fl BMSCs in CD45CD31Sca-1+CD24+ stem cell-like cells (MSCs), CD45CD31Sca-1PDGFRα+ osteochondrogenic progenitor cells (OPCs), CD45CD31Sca-1+CD24 adipogenic progenitor cells (APCs), and CD45CD31Sca-1ZFP423+ pre-adipocytes (PreAd). Left panels show the degree of enrichment in a pairwise comparison. Right panels show the cumulative enrichment scores (ES) representing the sum of enrichment scores for each cell type when compared across all other cell types (n = 3). Data in (A) and (D) represent log2 fold change ± log2(standard error) and other data represent mean ± SD. p < 0.05, ∗∗p < 0.01, and ∗∗∗p < 0.001 by Student's t test.
Figure 7
Figure 7
Derepressed Pax3 in the Absence of Bmi1 Promotes Adipogenic Differentiation of BMSCs (A–C) Genomic snapshot at the Hoxc gene locus (A), Ink4a/Arf locus (B), and Pax3 locus (C) showing ChIP-seq profiles of H2Aubi and H3K27me3 in Bmi1fl/fl and Prx1-Cre;Bmi1fl/fl BMSCs (n = 3). (D–F) Knockdown efficiency (D), changes in adipogenesis (E), and changes in osteogenesis (F) upon knockdown of Pax3 in Bmi1fl/fl and Prx1-Cre;Bmi1fl/fl mice (n = 3). All data represent mean ± SD. p < 0.05, ∗∗p < 0.01, and ∗∗∗p < 0.001 by two-way ANOVA with Bonferroni post hoc tests. See also Figure S5.

References

    1. Acar M., Kocherlakota K.S., Murphy M.M., Peyer J.G., Oguro H., Inra C.N., Jaiyeola C., Zhao Z., Luby-Phelps K., Morrison S.J. Deep imaging of bone marrow shows non-dividing stem cells are mainly perisinusoidal. Nature. 2015;526:126–130. - PMC - PubMed
    1. Alkema M.J., van der Lugt N.M., Bobeldijk R.C., Berns A., van Lohuizen M. Transformation of axial skeleton due to overexpression of bmi-1 in transgenic mice. Nature. 1995;374:724–727. - PubMed
    1. Ambrosi T.H., Scialdone A., Graja A., Gohlke S., Jank A.M., Bocian C., Woelk L., Fan H., Logan D.W., Schurmann A. Adipocyte accumulation in the bone marrow during obesity and aging impairs stem cell-based hematopoietic and bone regeneration. Cell Stem Cell. 2017;20:771–784.e6. - PMC - PubMed
    1. Azuara V., Perry P., Sauer S., Spivakov M., Jorgensen H.F., John R.M., Gouti M., Casanova M., Warnes G., Merkenschlager M. Chromatin signatures of pluripotent cell lines. Nat. Cell Biol. 2006;8:532–538. - PubMed
    1. Bernstein B.E., Mikkelsen T.S., Xie X., Kamal M., Huebert D.J., Cuff J., Fry B., Meissner A., Wernig M., Plath K. A bivalent chromatin structure marks key developmental genes in embryonic stem cells. Cell. 2006;125:315–326. - PubMed

Publication types

MeSH terms