. 2019 Aug 5;50(3):381-392.e5.
doi: 10.1016/j.devcel.2019.05.043. Epub 2019 Jun 27.

EGFR-Pak Signaling Selectively Regulates Glutamine Deprivation-Induced Macropinocytosis

Affiliations

EGFR-Pak Signaling Selectively Regulates Glutamine Deprivation-Induced Macropinocytosis

Szu-Wei Lee et al. Dev Cell. .

Abstract

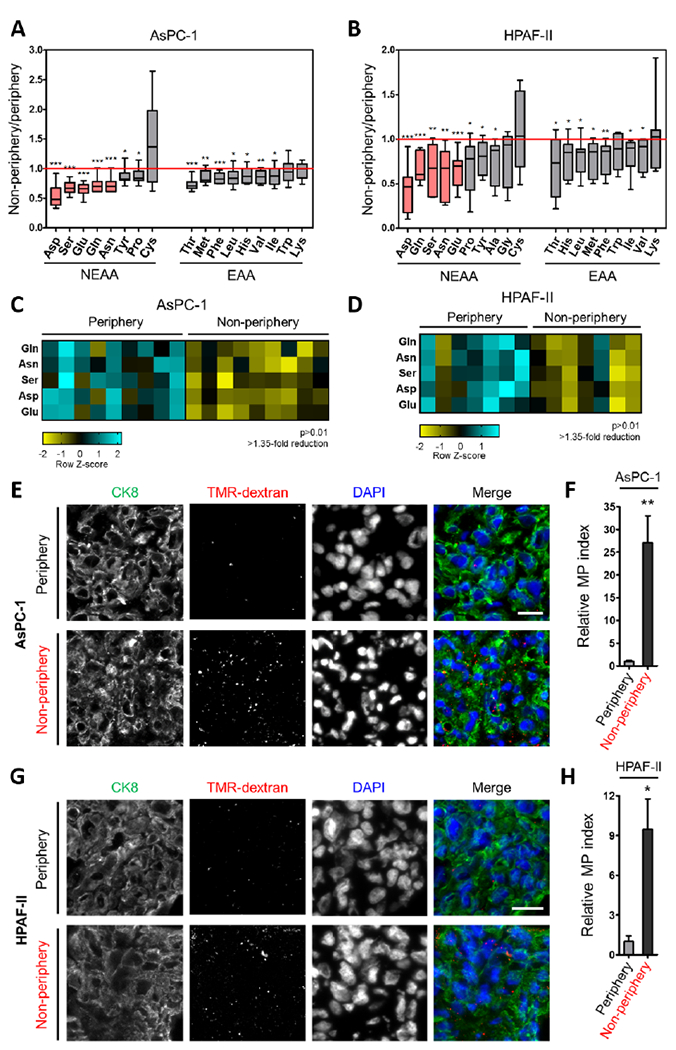
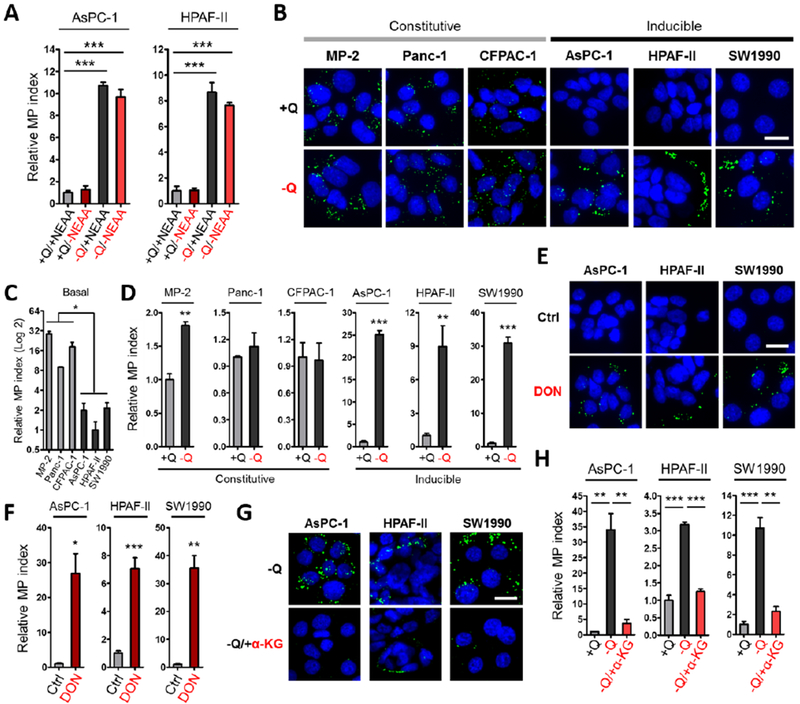
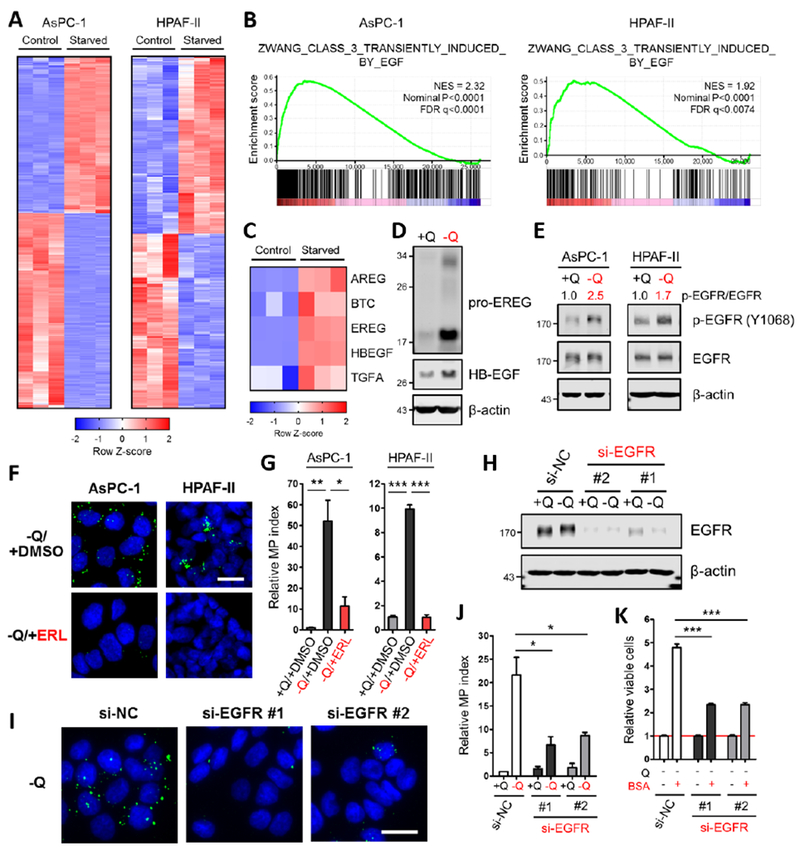
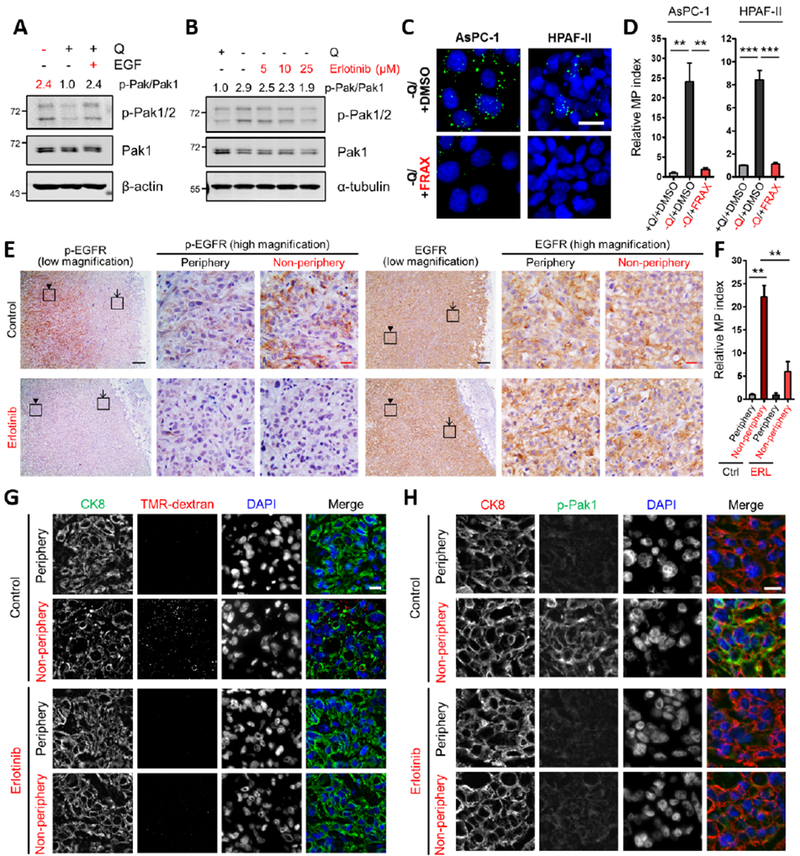
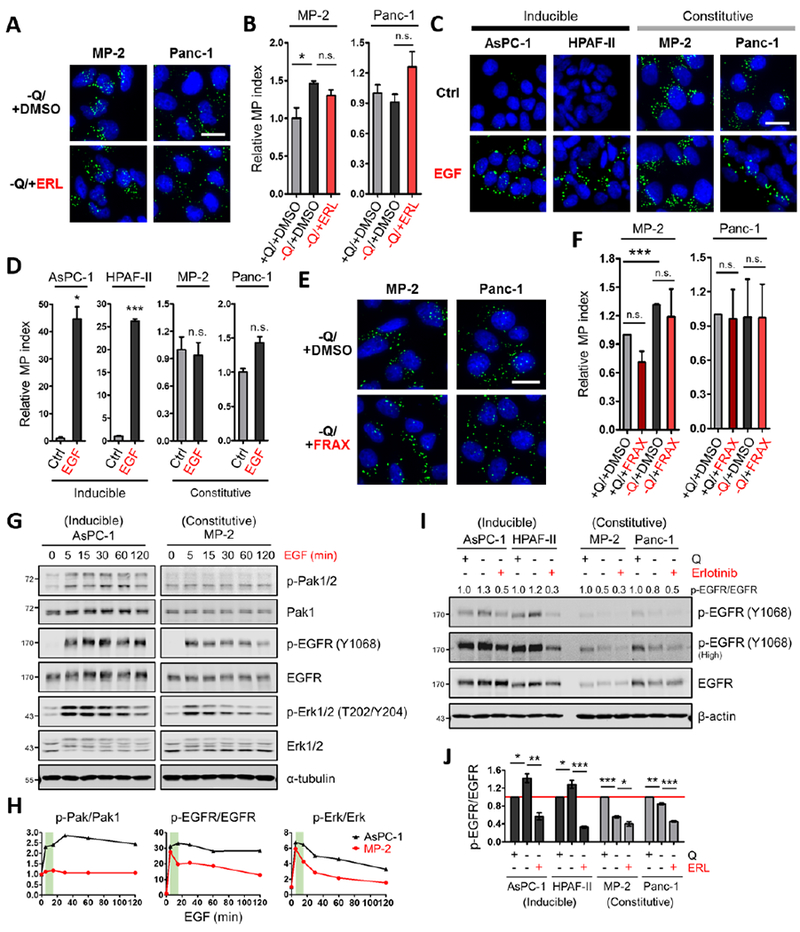
Macropinocytosis has emerged as an important nutrient-scavenging pathway that supports tumor cell fitness. By internalizing extracellular protein and targeting it for lysosomal degradation, this endocytic pathway functions as an amino acid supply route, permitting tumor cell growth and survival despite the nutrient-poor conditions of the tumor microenvironment. Here, we provide evidence that a subset of pancreatic ductal adenocarcinoma (PDAC) tumors are wired to integrate contextual metabolic inputs to regulate macropinocytosis, dialing up or down this uptake pathway depending on nutrient availability. We find that regional depletion of amino acids coincides with increased levels of macropinocytosis and that the scarcity of glutamine uniquely drives this process. Mechanistically, this stimulation of macropinocytosis depends on the nutrient stress-induced potentiation of epidermal growth factor receptor signaling that, through the activation of Pak, controls the extent of macropinocytosis in these cells. These results provide a mechanistic understanding of how nutritional cues can control protein scavenging in PDAC tumors.

Keywords: EGFR; Pak; Ras; cancer metabolism; macropinocytosis; pancreatic cancer; protein scavenging.


Conflict of interest statement

DECLARATION OF INTERESTS

C.C. is an inventor on a published patent application entitled “Cancer diagnostics, therapeutics, and drug discovery associated with macropinocytosis,” Pub. No.: US 2018/0335420 A1.

Figures

Figure 1.
Figure 1.. Regional deficiency of amino acids coincides with enhanced macropinocytic capacity in PDAC tumors.
(A, B) Intratumoral amino acid levels in the non-peripheral regions relative to the periphery of xenograft tumors derived from AsPC-1 (n=9 tumors) or HPAF-II (n=7 tumors) cells. Data are expressed as box-and-whiskers plots. Horizontal lines represent median; boxes range from the 25th to 75th percentiles; vertical lines extend down to the 10th percentile and up to the 90th percentiles. NEAA, non-essential amino acids. EAA, essential amino acids. (C, D) Heatmap profiles for intratumoral amino acids with >1.35-fold reduction and p>0.01. (E, G) Representative images from sections of xenograft tumor tissue with macropinosomes labeled with TMR-dextran (red) and tumor cells immunostained with anti-CK8 (green). Nuclei are labeled with DAPI (blue). Scale bar, 20 μm. (F, H) Quantification of macropinocytosis in xenograft tumor tissue. Error bars represent s.e.m. of n=5 tumors. *p<0.05, **p<0.01, ***p<0.001 by unpaired two-tailed Student’s t-test. See also Figure S1.
Figure 2.
Figure 2.. Glutamine deprivation stimulates macropinocytosis in a subset of PDAC cells.
(A) Quantification of macropinocytosis in the indicated cells treated without or with deprivation of glutamine (+Q and −Q) or non-essential amino acids (+NEAA or −NEAA). Data are presented relative to the values obtained for the nutrient-replete condition (+Q/+NEAA). (B) Representative images of macropinocytic uptake (FITC-dextran, green) in the indicated cell lines under glutamine-containing (+Q) or glutamine-free (−Q) conditions. (C) Quantification of basal macropinocytosis under glutamine-containing conditions in the indicated cell lines. Data are presented relative to the values obtained for HPAF-II cells. (D) Quantification of macropinocytosis under the conditions described in (B). Data are presented relative to the values obtained for the +Q condition. (E) Representative images of macropinocytosis in the indicated cells treated without or with 6-diazo-5-oxo-L-norleucine (DON) in glutamine-containing media. (F) Quantification of macropinocytosis under the conditions described in (E). Data are presented relative to the values obtained for the vehicle-only control condition. (G) Representative images of macropinocytosis in the indicated cells treated without or with a cell-permeable form of α-ketoglutarate (α-KG) in glutamine-free media. (H) Quantification of macropinocytosis in the indicated cells in glutamine-containing media and the conditions described in (G). Data are presented relative to the values obtained for the +Q condition. All graphs are representative of at least 3 independent experiments. All error bars represent s.e.m. for n=3 replicates with at least 300 cells scored per condition. *p<0.05, **p<0.01, ***p<0.001 by unpaired two-tailed Student’s t-test. Ctrl, control; Q, glutamine. Scale bar, 20 μm. See also Figure S2.
Figure 3.
Figure 3.. Glutamine deprivation drives macropinocytosis through activation of EGFR signaling.
(A) Heatmap profiles of differential gene expression between control and glutamine-starved AsPC-1 or HPAF-II cells (in triplicate) from RNA-Seq data sets. (B) Gene set enrichment analysis plots of glutamine-starved AsPC-1 or HPAF-II cells for EGF-induced genes. NES, normalized enrichment score; FDR, false discovery rate. (C) Heatmap of differential expression of the indicated EGFR ligands between control and glutamine-starved AsPC-1 cells (in triplicate) from RNA-Seq data sets. (D) Immunoblots assessing protein expression of EGFR ligands under glutamine-containing or glutamine-free conditions in AsPC-1 cells. β-actin was used as a loading control. (E) Immunoblots assessing protein expression of EGFR and phospho-EGFR (p-EGFR) under glutamine-containing or glutamine-free conditions in AsPC-1 and HPAF-II cells. β-actin was used as a loading control. The p-EGFR/EGFR ratios are shown. (F) Representative images of macropinocytotic uptake (green) in the indicated cells treated with vehicle (DMSO) or erlotinib (ERL) in glutamine-free media. Scale bar, 20 μm. (G) Quantification of macropinocytosis in the indicated cells in glutamine-containing media and under the conditions described in (F). Data are presented relative to the values obtained for the +Q/+DMSO condition. Data are representative of at least 3 independent experiments. Error bars represent s.e.m. for n=3 replicates with at least 800 cells scored per condition. (H) Immunoblots of EGFR expression in AsPC-1 cells transfected with a negative control siRNA (si-NC) or two independent siRNAs targeting EGFR (si-EGFR) under glutamine-containing or glutamine-free conditions. β-actin was used as a loading control. (I) Representative images of macropinocytosis in AsPC-1 cells transfected with the indicated siRNA under glutamine-free conditions. Scale bar, 20 μm. (J) Quantification of macropinocytosis in the indicated cells under the conditions described in (H). Data are presented relative to the values obtained for the +Q condition of si-NC cells. Error bars represent s.e.m. for n=3 independent experiments with at least 1,000 cells scored per condition. (K) Viability as assessed by MTT assay of the indicated cells cultured in glutamine-free media without or with supplementation with 3% BSA after 5 days. Data are presented relative to the values obtained for each −Q condition (indicated by the red line). Data are representative of at least 3 independent experiments with error bars representing s.e.m. for n=3 replicates. *p<0.05, **p<0.01, ***p<0.001 by unpaired two-tailed Student’s t-test. Q, glutamine. See also Figures S3 and Table S1–S3.
Figure 4.
Figure 4.. EGFR signaling in response to glutamine depletion drives macropinocytosis via Pak1.
(A, B) Immunoblots assessing phosphorylation of Pak1/2 [p-Pak1 (S199/204)/p-Pak2 (S192/197)] in AsPC-1 cells under the indicated conditions. EGF treatment (A) was done at 100 ng/mL for 5 min. Erlotinib treatment (B) was done at the indicated concentrations for 2 hours. β-actin or α-tubulin was used as a loading control. The p-Pak/Pak1 ratios are shown. (C) Representative images of macropinocytosis (green) in the indicated cells treated with vehicle (DMSO) or FRAX597 (FRAX) in glutamine-free media. Scale bar, 20 μm. (D) Quantification of macropinocytosis in the indicated cells treated with DMSO in glutamine-containing media and under the conditions described in (C). Data are presented relative to the values obtained for the +Q/+DMSO condition and representative of at least 3 independent experiments. Error bars represent s.e.m. of n=3 replicates with at least 650 cells scored per condition. (E) Immunohistochemical staining of p-EGFR and total EGFR protein expression in AsPC-1 xenograft tumors treated with vehicle control or erlotinib. The inset boxes in the low-magnification images indicate the areas shown in the high-magnification images. The arrows indicate the tumor peripheral regions, and the arrowheads indicate the tumor non-peripheral regions. Black scale bar, 200 μm; red scale bar, 20 μm. (F) Quantification of macropinocytosis in AsPC-1 xenograft tumors treated with vehicle control (Ctrl) or erlotinib (ERL). Error bars represent s.e.m. of n=3 tumors. (G) Representative images from sections of AsPC-1 xenograft tumors treated with vehicle control or erlotinib with macropinosomes labeled with TMR-dextran (red) and tumor cells immunostained with anti-CK8 (green). Nuclei are labeled with DAPI (blue). Scale bar, 20 μm. (H) Immunofluorescence staining in AsPC-1 xenograft tumors treated with vehicle control or erlotinib. Tumor sections were stained with anti-CK8 (red), anti-p-Pak1 (green) and DAPI (blue). Scale bar, 20 μm. **p<0.01, ***p<0.001 by unpaired two-tailed Student’s t-test. Q, glutamine. See also Figure S4.
Figure 5.
Figure 5.. EGFR signaling dynamics in PDAC cells with inducible or constitutive macropinocytosis.
(A) Representative images of macropinocytotic uptake (green) in the indicated cells treated with vehicle (DMSO) or erlotinib (ERL) in glutamine-free media. Scale bar, 20 μm. (B) Quantification of macropinocytosis in the indicated cells treated with DMSO in glutamine-containing media and under the conditions described in (A). Data are presented relative to the values obtained for the +Q/+DMSO condition. Data are representative of at least 3 independent experiments. Error bars represent s.e.m. for n=3 replicates with at least 300 cells scored per condition. (C) Representative images of macropinocytotic uptake in the indicated cells treated without or with EGF (100 ng/mL, 5 min) in glutamine-containing media. Ctrl, control. Scale bar, 20 μm. (D) Quantification of macropinocytosis under the conditions described in (C). Data are presented relative to the values obtained for the control condition. (E) Representative images of macropinocytosis in the indicated cells treated with vehicle (DMSO) or FRAX597 (FRAX) in glutamine-free media. (F) Quantification of macropinocytosis in the indicated cells treated with DMSO or FRAX597 in glutamine-containing media and under the conditions described in (E). Data are presented relative to the values obtained for the +Q/+DMSO condition. Error bars represent s.e.m. with at least 400 cells scored per condition. (G) Immunoblots assessing phosphorylation of Pak1/2 [p-Pak1 (S199/204)/p-Pak2 (S192/197)], EGFR and Erk1/2 in the indicated cells treated with EGF (25 ng/mL) for the indicated time in glutamine-containing media. α-tubulin was used as a loading control. Results shown are representative of at least 3 independent experiments. (H) Quantification of phosphoprotein/total protein ratios from the immunoblots in (G). Data are presented relative to the values obtained for each 0 time point (set as 1). The green areas highlight the changes of p-Pak1/2, p-EGFR and p-Erk1/2 from 5 to 15 min post EGF treatment. (I) Representative immunoblots of EGFR phosphorylation in the indicated cells treated with vehicle (DMSO) or erlotinib (25 μM, 2 hours) in glutamine-containing or glutamine-free media. β-actin was used as a loading control. The p-EGFR/EGFR ratios are shown. (J) Quantification of p-EGFR/EGFR ratios from immunoblots as described in (I). Data are presented relative to the values obtained for each +Q/-ERL condition (indicated by the red line). Error bars represent s.e.m. of n=3 independent experiments. ERL, erlotinib. *p<0.05, **p<0.01, ***p<0.001 by unpaired two-tailed Student’s t-test. Q, glutamine; n.s., not significant. See also Figure S5.

Comment in

References

    1. Amstutz B, Gastaldelli M, Kalin S, Imelli N, Boucke K, Wandeler E, Mercer J, Hemmi S, and Greber UF (2008). Subversion of CtBP1-controlled macropinocytosis by human adenovirus serotype 3. Embo J 27, 956–969. - PMC - PubMed
    1. Araki N, Johnson MT, and Swanson JA (1996). A role for phosphoinositide 3-kinase in the completion of macropinocytosis and phagocytosis by macrophages. J Cell Biol 135, 1249–1260. - PMC - PubMed
    1. Ardito CM, Gruner BM, Takeuchi KK, Lubeseder-Martellato C, Teichmann N, Mazur PK, Delgiorno KE, Carpenter ES, Halbrook CJ, Hall JC, et al. (2012). EGF receptor is required for KRAS-induced pancreatic tumorigenesis. Cancer Cell 22, 304–317. - PMC - PubMed
    1. Biancur DE, Paulo JA, Malachowska B, Quiles Del Rey M, Sousa CM, Wang X, Sohn ASW, Chu GC, Gygi SP, Harper JW, et al. (2017). Compensatory metabolic networks in pancreatic cancers upon perturbation of glutamine metabolism. Nat Commun 8, 15965. - PMC - PubMed
    1. Brunk U, Schellens J, and Westermark B (1976). Influence of epidermal growth factor (EGF) on ruffling activity, pinocytosis and proliferation of cultivated human glia cells. Exp Cell Res 103, 295–302. - PubMed

Publication types