SynMyco transposon: engineering transposon vectors for efficient transformation of minimal genomes
- PMID: 31257417
- PMCID: PMC6704405
- DOI: 10.1093/dnares/dsz012
SynMyco transposon: engineering transposon vectors for efficient transformation of minimal genomes
Abstract
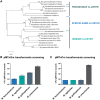
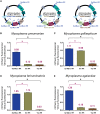
Mycoplasmas are important model organisms for Systems and Synthetic Biology, and are pathogenic to a wide variety of species. Despite their relevance, many of the tools established for genome editing in other microorganisms are not available for Mycoplasmas. The Tn4001 transposon is the reference tool to work with these bacteria, but the transformation efficiencies (TEs) reported for the different species vary substantially. Here, we explore the mechanisms underlying these differences in four Mycoplasma species, Mycoplasma agalactiae, Mycoplasma feriruminatoris, Mycoplasma gallisepticum and Mycoplasma pneumoniae, selected for being representative members of each cluster of the Mycoplasma genus. We found that regulatory regions (RRs) driving the expression of the transposase and the antibiotic resistance marker have a major impact on the TEs. We then designed a synthetic RR termed SynMyco RR to control the expression of the key transposon vector elements. Using this synthetic RR, we were able to increase the TE for M. gallisepticum, M. feriruminatoris and M. agalactiae by 30-, 980- and 1036-fold, respectively. Finally, to illustrate the potential of this new transposon, we performed the first essentiality study in M. agalactiae, basing our study on more than 199,000 genome insertions.
Keywords: Mycoplasma; essentiality; regulatory region; transformation efficiency; transposon.
© The Author(s) 2019. Published by Oxford University Press on behalf of Kazusa DNA Research Institute.
Figures


Similar articles
-
Construction of mini-Tn4001 transposon vector for Mycoplasma gallisepticum.Sci China Life Sci. 2010 Nov;53(11):1340-5. doi: 10.1007/s11427-010-4082-5. Epub 2010 Nov 3. Sci China Life Sci. 2010. PMID: 21046326
-
Construction of mini-Tn4001tet and its use in Mycoplasma gallisepticum.Plasmid. 2002 Mar;47(2):129-37. doi: 10.1006/plas.2001.1558. Plasmid. 2002. PMID: 11982334
-
Construction of Tn4001lac derivatives to be used as promoter probe vectors in mycoplasmas.Gene. 1993 Dec 31;137(2):217-22. doi: 10.1016/0378-1119(93)90009-r. Gene. 1993. PMID: 8299950
-
Tools for the genetic analysis of Mycoplasma.Int J Med Microbiol. 2007 Feb;297(1):37-44. doi: 10.1016/j.ijmm.2006.11.001. Epub 2007 Jan 16. Int J Med Microbiol. 2007. PMID: 17223385 Review.
-
Mycoplasma genomics: tailoring the genome for minimal life requirements through reductive evolution.Front Biosci. 2007 Jan 1;12:2020-8. doi: 10.2741/2207. Front Biosci. 2007. PMID: 17127440 Review.
Cited by
-
Engineering Mycoplasma pneumoniae to bypass the association with Guillain-Barré syndrome.Microbes Infect. 2024 Jul-Aug;26(5-6):105342. doi: 10.1016/j.micinf.2024.105342. Epub 2024 Apr 26. Microbes Infect. 2024. PMID: 38679229 Free PMC article.
-
SURE editing: combining oligo-recombineering and programmable insertion/deletion of selection markers to efficiently edit the Mycoplasma pneumoniae genome.Nucleic Acids Res. 2022 Dec 9;50(22):e127. doi: 10.1093/nar/gkac836. Nucleic Acids Res. 2022. PMID: 36215032 Free PMC article.
-
Phenotypic and genetic insights into efflux pump mechanism in Mycoplasma anserisalpingitidis.Front Microbiol. 2023 Jul 11;14:1216893. doi: 10.3389/fmicb.2023.1216893. eCollection 2023. Front Microbiol. 2023. PMID: 37502405 Free PMC article.
-
Quantitative essentiality in a reduced genome: a functional, regulatory and structural fitness map.Mol Syst Biol. 2025 Aug 13. doi: 10.1038/s44320-025-00133-1. Online ahead of print. Mol Syst Biol. 2025. PMID: 40804181
-
Comprehensive quantitative modeling of translation efficiency in a genome-reduced bacterium.Mol Syst Biol. 2023 Oct 12;19(10):e11301. doi: 10.15252/msb.202211301. Epub 2023 Aug 29. Mol Syst Biol. 2023. PMID: 37642167 Free PMC article.
References
-
- Guell M., van Noort V., Yus E., et al.2009, Transcriptome complexity in a genome-reduced bacterium, Science, 326, 1268–71. - PubMed
MeSH terms
Substances
LinkOut - more resources
Full Text Sources
Other Literature Sources

