. 2019 Oct 15;70(19):5131-5144.
doi: 10.1093/jxb/erz303.

Genetic architecture of leaf photosynthesis in rice revealed by different types of reciprocal mapping populations

Affiliations

Genetic architecture of leaf photosynthesis in rice revealed by different types of reciprocal mapping populations

Shunsuke Adachi et al. J Exp Bot. .

Abstract

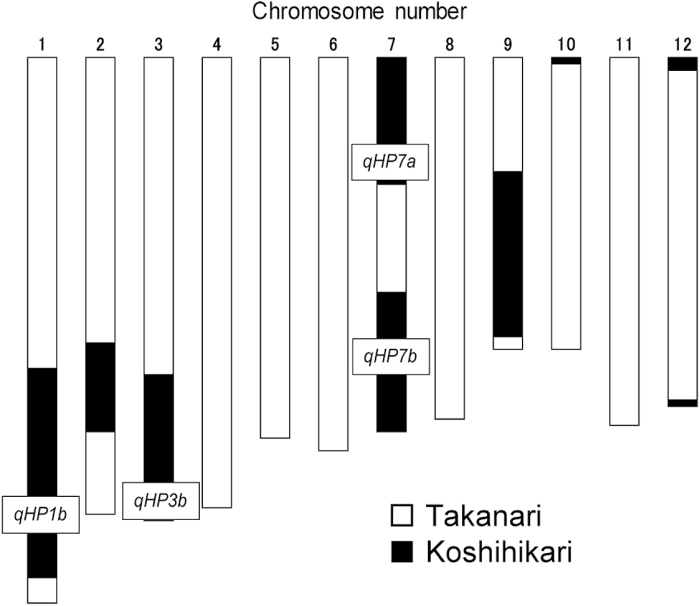
The improvement of leaf net photosynthetic rate (An) is a major challenge in enhancing crop productivity. However, the genetic control of An among natural genetic accessions is still poorly understood. The high-yielding indica cultivar Takanari has the highest An of all rice cultivars, 20-30% higher than that of the high-quality japonica cultivar Koshihikari. By using reciprocal backcross inbred lines and chromosome segment substitution lines derived from a cross between Takanari and Koshihikari, we identified three quantitative trait loci (QTLs) where the Takanari alleles enhanced An in plants with a Koshihikari genetic background and five QTLs where the Koshihikari alleles enhanced An in plants with a Takanari genetic background. Two QTLs were expressed in plants with both backgrounds (type I QTL). The expression of other QTLs depended strongly on genetic background (type II QTL). These beneficial alleles increased stomatal conductance, the initial slope of An versus intercellular CO2 concentration, or An at CO2 saturation. Pyramiding of these alleles consistently increased An. Some alleles positively affected biomass production and grain yield. These alleles associated with photosynthesis and yield can be a valuable tool in rice breeding programs via DNA marker-assisted selection.

Keywords: Backcross inbred line; chromosome segment substitution line; nitrogen content; phenology; photosynthesis; quantitative trait locus; reciprocal mapping population; rice; stomatal conductance; yield.


Figures

Fig. 1.
Fig. 1.
Frequency distributions of photosynthetic rate (An) of BILs with Koshihikari background (A, C) and Takanari background (B, D) grown in the paddy field. Arrowheads indicate average values: black (K), Koshihikari; white (T), Takanari; gray, inbred lines.
Fig. 2.
Fig. 2.
Photosynthetic rates (An) of flag leaves at full heading stage of T-CSSLs (Koshihikari background) grown in the paddy field. Error bars represent SD (n=3). Symbols indicate significant differences from Koshihikari at the †10%, *5%, **1%, and ***0.1% α level (Dunnett’s test). (This figure is available in color at JXB online.)
Fig. 3.
Fig. 3.
Photosynthetic rates (An) of flag leaves at full heading stage of K-CSSLs (Takanari background) grown in the paddy field. Error bars represent SD (n=3). Asterisks indicate significant differences from Takanari at the *5%, **1%, and ***0.1% α level (Dunnett’s test). NA, not available. (This figure is available in color at JXB online.)
Fig. 4.
Fig. 4.
Summary of identified QTLs. (A) Graphical genotypes of mapping populations. Orange, homozygous for Koshihikari; blue, homozygous for Takanari. BILs (BKTs and BTKs) were used in 2009 and 2010, and CSSLs (T-CSSLs and K-CSSLs) were used in 2011 and 2012. (B) Locations of QTLs for photosynthetic rate (An). (C) Locations of QTLs for stomatal conductance (gs). (D) Locations of QTLs for leaf nitrogen content (LNC). Circles represent the locations of QTLs for An that were repeatedly identified in different years.
Fig. 5.
Fig. 5.
Comparisons of photosynthetic rate (An) (A), stomatal conductance (gs) (B), initial slope of the AnCi curve (C), An at CO2 saturation (Asat) (D), ratio of intercellular CO2 concentration (Ci) to ambient CO2 concentration (Ca) (Ci/Ca) (E), and leaf nitrogen content (LNC) (F) between Koshihikari and Takanari grown in pots. Error bars represent SD (n=6). Asterisks indicate significant differences between Koshihikari and Takanari at the *5% and **1% α level (Student’s t-test). ns, not significant.
Fig. 6.
Fig. 6.
Photosynthetic rate (An) of plants carrying Takanari allele(s) in the Koshihikari genetic background in 2016 (A) and Koshihikari allele(s) in the Takanari genetic background in 2015 (B–D) in the paddy field. Ca was controlled at 400±1 μmol mol−1 and other conditions were the same as in the field measurements in 2009–2012. Error bars represent SD (n=4). Bars with the same letter are not significantly different among the cultivar(s) and lines in each figure at the 10% α level (Tukey–Kramer test).
Fig. 7.
Fig. 7.
Graphical genotype of line BTK-a, with extremely high An, which was identified previously among the BILs (Koshihikari/Takanari//Takanari) by Adachi et al. (2013). Black, homozygous for Koshihikari; white, homozygous for Takanari. Boxes: QTLs for An located on the Koshihikari homozygous region in BTK-a. An, initial slope of the AnCi curve, and Asat of BTK-a were ~25–30% higher than those of Takanari (Adachi et al., 2013).

Similar articles

Cited by

References

    1. Adachi S, Baptista LZ, Sueyoshi T, Murata K, Yamamoto T, Ebitani T, Ookawa T, Hirasawa T. 2014. Introgression of two chromosome regions for leaf photosynthesis from an indica rice into the genetic background of a japonica rice. Journal of Experimental Botany 65, 2049–2056. - PMC - PubMed
    1. Adachi S, Nakae T, Uchida M, et al. . 2013. The mesophyll anatomy enhancing CO2 diffusion is a key trait for improving rice photosynthesis. Journal of Experimental Botany 64, 1061–1072. - PubMed
    1. Adachi S, Nito N, Kondo M, Yamamoto T, Arai-Sanoh Y, Ando T, Ookawa T, Yano M, Hirasawa T. 2011a Identification of chromosomal regions controlling the leaf photosynthetic rate in rice by using a progeny from japonica and high-yielding indica varieties. Plant Production Science 14, 118–127.
    1. Adachi S, Tsuru Y, Nito N, Murata K, Yamamoto T, Ebitani T, Ookawa T, Hirasawa T. 2011b Identification and characterization of genomic regions on chromosomes 4 and 8 that control the rate of photosynthesis in rice leaves. Journal of Experimental Botany 62, 1927–1938. - PMC - PubMed
    1. Adachi S, Yoshikawa K, Yamanouchi U, Tanabata T, Sun J, Ookawa T, Yamamoto T, Sage RF, Hirasawa T, Yonemaru J. 2017. Fine mapping of Carbon Assimilation Rate 8, a quantitative trait locus for flag leaf nitrogen content, stomatal conductance and photosynthesis in rice. Frontiers in Plant Science 8, 60. - PMC - PubMed

Publication types