

Quantitative assessment of renal structural and functional changes in chronic kidney disease using multi-parametric magnetic resonance imaging
- PMID: 31257440
- PMCID: PMC7282828
- DOI: 10.1093/ndt/gfz129
Quantitative assessment of renal structural and functional changes in chronic kidney disease using multi-parametric magnetic resonance imaging
Abstract
Background: Multi-parametric magnetic resonance imaging (MRI) provides the potential for a more comprehensive non-invasive assessment of organ structure and function than individual MRI measures, but has not previously been comprehensively evaluated in chronic kidney disease (CKD).
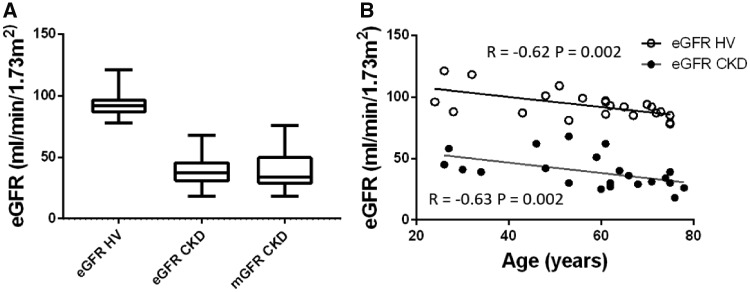
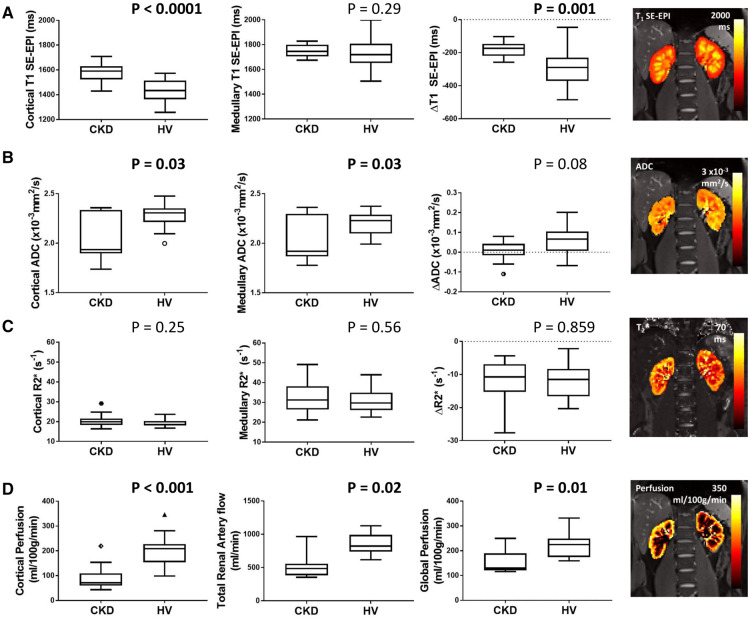
Methods: We performed multi-parametric renal MRI in persons with CKD (n = 22, 61 ± 24 years) who had a renal biopsy and measured glomerular filtration rate (mGFR), and matched healthy volunteers (HV) (n = 22, 61 ± 25 years). Longitudinal relaxation time (T1), diffusion-weighted imaging, renal blood flow (phase contrast MRI), cortical perfusion (arterial spin labelling) and blood-oxygen-level-dependent relaxation rate (R2*) were evaluated.
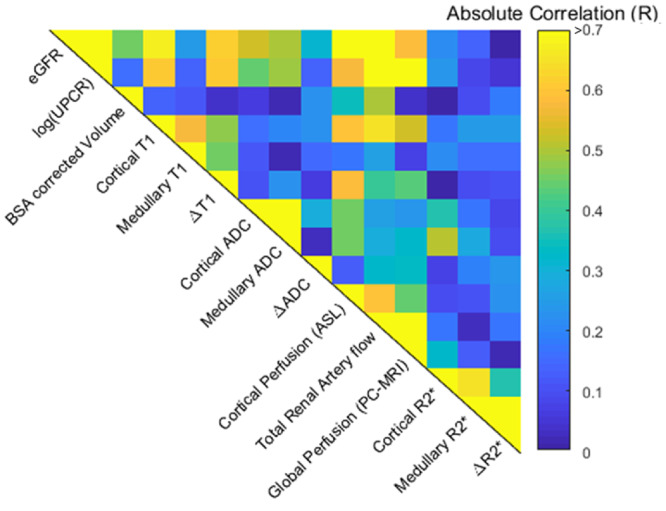
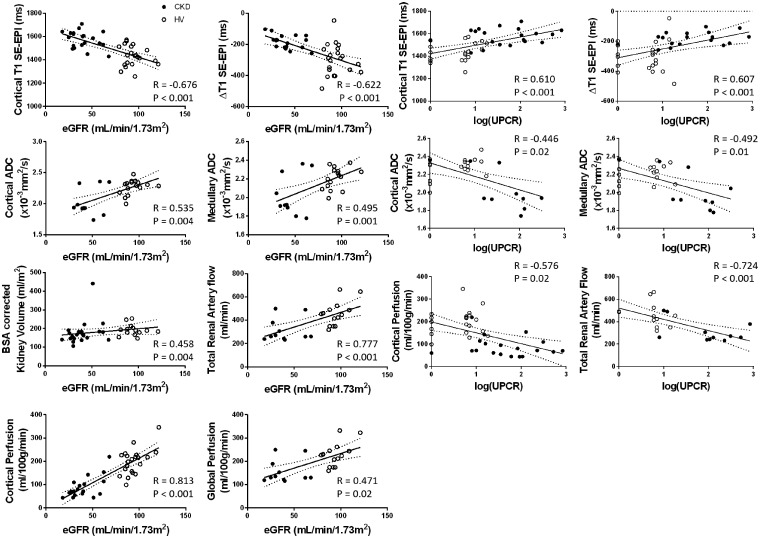
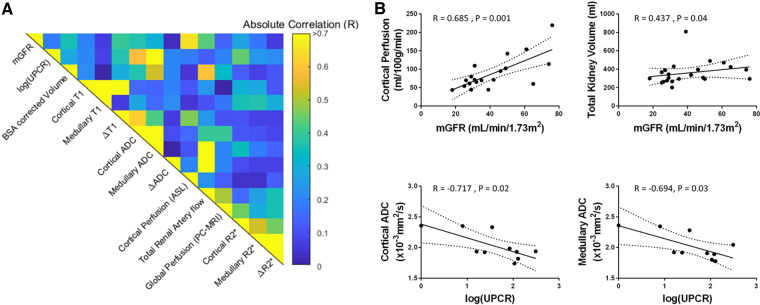
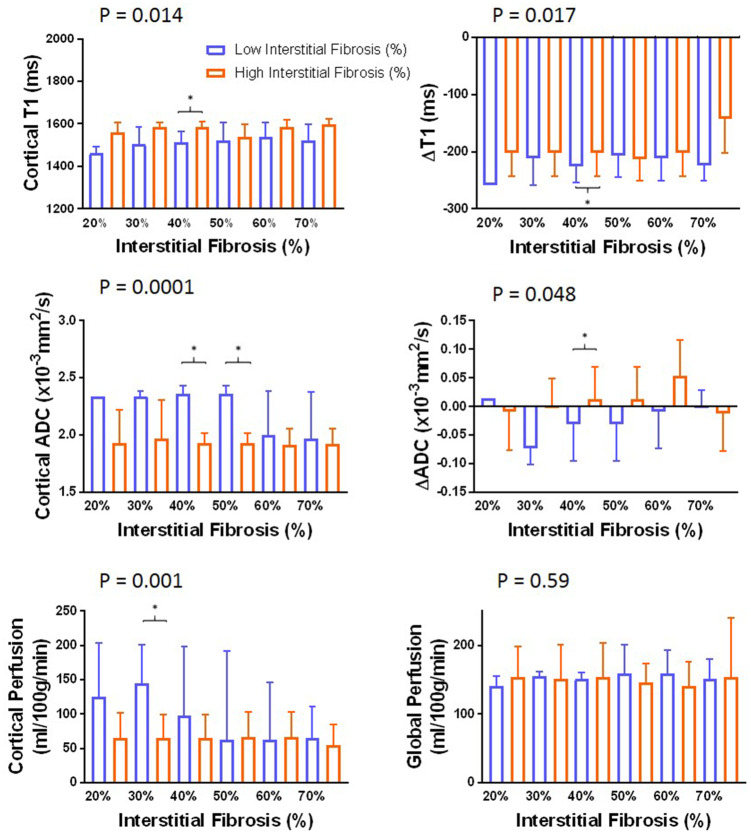
Results: MRI evidenced excellent reproducibility in CKD (coefficient of variation <10%). Significant differences between CKD and HVs included cortical and corticomedullary difference (CMD) in T1, cortical and medullary apparent diffusion coefficient (ADC), renal artery blood flow and cortical perfusion. MRI measures correlated with kidney function in a combined CKD and HV analysis: estimated GFR correlated with cortical T1 (r = -0.68), T1 CMD (r = -0.62), cortical (r = 0.54) and medullary ADC (r = 0.49), renal artery flow (r = 0.78) and cortical perfusion (r = 0.81); log urine protein to creatinine ratio (UPCR) correlated with cortical T1 (r = 0.61), T1 CMD (r = 0.61), cortical (r = -0.45) and medullary ADC (r = -0.49), renal artery flow (r = -0.72) and cortical perfusion (r = -0.58). MRI measures (cortical T1 and ADC, T1 and ADC CMD, cortical perfusion) differed between low/high interstitial fibrosis groups at 30-40% fibrosis threshold.
Conclusion: Comprehensive multi-parametric MRI is reproducible and correlates well with available measures of renal function and pathology. Larger longitudinal studies are warranted to evaluate its potential to stratify prognosis and response to therapy in CKD.
Keywords: chronic kidney disease; haemodynamics; magnetic resonance imaging; multi-parametric; renal function.
© The Author(s) 2019. Published by Oxford University Press on behalf of ERA-EDTA.
Figures
Comment in
-
Recent findings on the clinical utility of renal magnetic resonance imaging biomarkers.Nephrol Dial Transplant. 2020 Jun 1;35(6):915-919. doi: 10.1093/ndt/gfaa125. Nephrol Dial Transplant. 2020. PMID: 32516808 No abstract available.
References
-
- Eknoyan G, Lameire N, Barsoum R. et al. The burden of kidney disease: improving global outcomes. Kidney Int 2004; 66: 1310–1314 - PubMed
-
- Taal MW, Brenner BM. Adaptation to nephron loss and mechanisms of progression in chronic kidney disease. In: Brenner and Rector’s the Kidney, 2011, 1918–1971. https://expertconsult.inkling.com/store/book/skorecki-brenner-rectors-ki...
Publication types
MeSH terms
Grants and funding
LinkOut - more resources
Full Text Sources
Other Literature Sources
Medical
